Strength and Stability - SNL Financial
Strength and Stability - SNL Financial
Strength and Stability - SNL Financial

You also want an ePaper? Increase the reach of your titles
YUMPU automatically turns print PDFs into web optimized ePapers that Google loves.
FIRST COMMONWEALTH FINANCIAL CORPORATION AND SUBSIDIARIES<br />
ITEM 7.<br />
Management’s Discussion <strong>and</strong> Analysis of <strong>Financial</strong> Condition <strong>and</strong> Results of Operations<br />
(Continued)<br />
Results of Operations—2008 Compared to 2007 (Continued)<br />
Non-Interest Expense (Continued)<br />
Other professional fees <strong>and</strong> services increased $632 thous<strong>and</strong> due to additional expenses incurred for evaluating<br />
pooled trust preferred collateralized debt obligations for fair value <strong>and</strong> impairment, professional development,<br />
<strong>and</strong> sales training.<br />
Other operating expenses increased $843 thous<strong>and</strong> primarily due to costs associated with higher loan<br />
originations, <strong>and</strong> higher collection <strong>and</strong> repossession expense.<br />
An impairment charge of $1.2 million was recorded in 2008 on low income housing partnerships because our<br />
estimated future benefits could not support our carrying value.<br />
Income Tax<br />
Income tax expense increased $679 thous<strong>and</strong> in 2008 primarily due to decreases in tax free income <strong>and</strong> tax<br />
credits, which resulted in an increase in our effective tax rate to 13.3% in 2008 compared to 11.4% in 2007.<br />
<strong>Financial</strong> Condition<br />
First Commonwealth’s total assets increased $542.3 million, or 9.2%, in 2008, primarily due to an increase in<br />
loans of $720.6 million, or 19.5%, offset by a decrease in investments of $193.5 million, or 11.8%. First<br />
Commonwealth’s total liabilities increased by $458.3 million, or 8.6%, in 2008. Total short-term borrowings<br />
increased $798.5 million, or 225.4%, which was partially offset by a decrease in long-term debt of $271.7<br />
million, or 49.6%, <strong>and</strong> a decrease in deposits of $66.9 million, or 1.5%.<br />
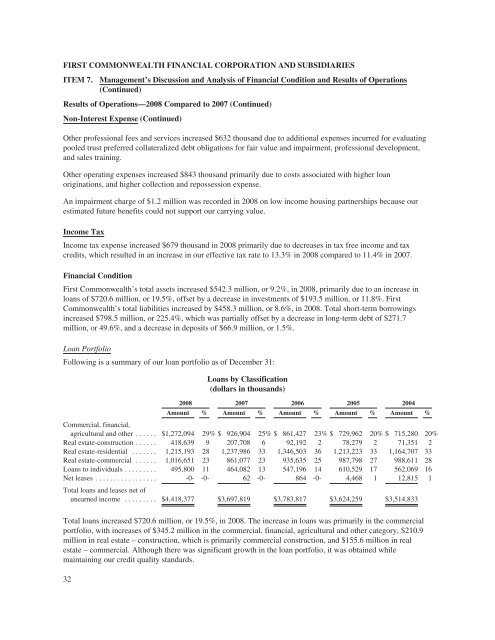
Loan Portfolio<br />
Following is a summary of our loan portfolio as of December 31:<br />
Loans by Classification<br />
(dollars in thous<strong>and</strong>s)<br />
2008 2007 2006 2005 2004<br />
Amount % Amount % Amount % Amount % Amount %<br />
Commercial, financial,<br />
agricultural <strong>and</strong> other ...... $1,272,094 29% $ 926,904 25% $ 861,427 23% $ 729,962 20% $ 715,280 20%<br />
Real estate-construction ...... 418,639 9 207,708 6 92,192 2 78,279 2 71,351 2<br />
Real estate-residential ....... 1,215,193 28 1,237,986 33 1,346,503 36 1,213,223 33 1,164,707 33<br />
Real estate-commercial ...... 1,016,651 23 861,077 23 935,635 25 987,798 27 988,611 28<br />
Loans to individuals ......... 495,800 11 464,082 13 547,196 14 610,529 17 562,069 16<br />
Net leases ................. -0- -0- 62 -0- 864 -0- 4,468 1 12,815 1<br />
Total loans <strong>and</strong> leases net of<br />
unearned income ......... $4,418,377 $3,697,819 $3,783,817 $3,624,259 $3,514,833<br />
Total loans increased $720.6 million, or 19.5%, in 2008. The increase in loans was primarily in the commercial<br />
portfolio, with increases of $345.2 million in the commercial, financial, agricultural <strong>and</strong> other category, $210.9<br />
million in real estate – construction, which is primarily commercial construction, <strong>and</strong> $155.6 million in real<br />
estate – commercial. Although there was significant growth in the loan portfolio, it was obtained while<br />
maintaining our credit quality st<strong>and</strong>ards.<br />
32