Strength and Stability - SNL Financial
Strength and Stability - SNL Financial
Strength and Stability - SNL Financial

You also want an ePaper? Increase the reach of your titles
YUMPU automatically turns print PDFs into web optimized ePapers that Google loves.
FIRST COMMONWEALTH FINANCIAL CORPORATION AND SUBSIDIARIES<br />
ITEM 7. Management’s Discussion <strong>and</strong> Analysis of <strong>Financial</strong> Condition <strong>and</strong> Results of Operations<br />
(Continued)<br />
<strong>Financial</strong> Condition (Continued)<br />
Allowance for Credit Losses (Continued)<br />
Management reviews the local <strong>and</strong> national economic information <strong>and</strong> industry data, including the trends in the<br />
industries we believe are higher risk, <strong>and</strong> an allocation is made to the allowance for credit losses based on this<br />
review, which is reflected in the “unallocated” line of the above table. Prior to 2008, there was also an<br />
unallocated portion of the allowance to account for any factors or conditions that may cause a potential credit<br />
loss that were not specifically identifiable or considered in the allowance for credit loss methodology. In 2008,<br />
management determined that the allocation made based upon the review of economic <strong>and</strong> industry data was<br />
sufficient to also account for any other factors that are not specifically identifiable. For years prior to 2008, the<br />
“unallocated” line of the above table includes both the allocation made by management based upon review of<br />
economic <strong>and</strong> industry data <strong>and</strong> the additional allocation that was made for items that were not specifically<br />
identifiable. The unallocated balance decreased $352 thous<strong>and</strong> from $4.3 million at December 31, 2007 to $4.0<br />
million at December 31, 2008.<br />
Investment Portfolio<br />
Marketable securities that we hold in our investment portfolio, which are classified as “securities available for<br />
sale,” may be a source of liquidity; however, we do not anticipate liquidating the investments prior to maturity.<br />
As indicated in Note 21, $68.4 million of available for sale securities are classified as Level 3 assets because of<br />
inactivity in the market <strong>and</strong> therefore would not be considered a source of liquidity. As of December 31, 2008,<br />
securities available for sale had an amortized cost <strong>and</strong> fair value of $1.4 billion. Gross unrealized gains were<br />
$28.7 million <strong>and</strong> gross unrealized losses were $61.9 million.<br />
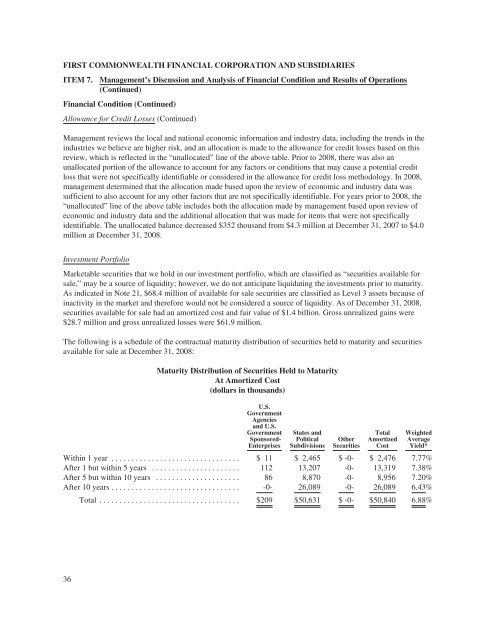
The following is a schedule of the contractual maturity distribution of securities held to maturity <strong>and</strong> securities<br />
available for sale at December 31, 2008:<br />
Maturity Distribution of Securities Held to Maturity<br />
At Amortized Cost<br />
(dollars in thous<strong>and</strong>s)<br />
U.S.<br />
Government<br />
Agencies<br />
<strong>and</strong> U.S.<br />
Government<br />
Sponsored-<br />
Enterprises<br />
States <strong>and</strong><br />
Political<br />
Subdivisions<br />
Other<br />
Securities<br />
Total<br />
Amortized<br />
Cost<br />
Weighted<br />
Average<br />
Yield*<br />
Within 1 year ................................ $ 11 $ 2,465 $ -0- $ 2,476 7.77%<br />
After 1 but within 5 years ...................... 112 13,207 -0- 13,319 7.38%<br />
After 5 but within 10 years ..................... 86 8,870 -0- 8,956 7.20%<br />
After 10 years ................................ -0- 26,089 -0- 26,089 6.43%<br />
Total ................................... $209 $50,631 $ -0- $50,840 6.88%<br />
36