download (pdf, 11MB) - SNV
download (pdf, 11MB) - SNV
download (pdf, 11MB) - SNV

Create successful ePaper yourself
Turn your PDF publications into a flip-book with our unique Google optimized e-Paper software.
iv. Observation of kitchen and the surroundings of the household to assess impacts of biogas plant on<br />
household sanitation and cleanliness,<br />
v. Analysis of collected data and information using appropriate computer software programmes,<br />
vi. Synthesizing of data and information to prepare the Draft Final Report, vii. Preparation of Final Report<br />
incorporating the comments & suggestions received from BSP.<br />
1.5.4 Sampling<br />
The TOR provided by BSP lo DevPart contained the sampled households for this study. A total of 100 families<br />
was selected randomly from among plants constructed by different branch, sub-branch and depot offices of<br />
NGG, NRG and PGG during the fiscal years 1994/95 and 1995/96 in eight districts of the Kingdom. The<br />
districts where sampled plants were located are shown in country map in pagc-7. Because of the fact that all the<br />
three companies whose plant were selected for the study, had their focus areas in the western and central<br />
development regions, the distribution covered only a limited area of the kingdom. The districts covered under<br />
this study were; Gorkha, Lamjung, Tanahu, Kaski, Syangja, Chitwan, Makawanpur and Dhading. The table<br />
below indicates the distribution of the sampled plants. :<br />
Table-1:<br />
Distribution Of Sampled Plants<br />
Company District Plant Location Total Grand Total<br />
NGG<br />
NRG<br />
PGG<br />
Gorkha<br />
Lamjung<br />
Tanahu<br />
Chitwan<br />
Makawanpur<br />
Dhading<br />
Tanahu<br />
Kaski<br />
Syangja<br />
Tanahu<br />
Kaski<br />
Hill<br />
19<br />
8<br />
10<br />
0<br />
0<br />
1<br />
5<br />
9<br />
21<br />
14<br />
6<br />
Inner Terai<br />
0<br />
0<br />
0<br />
5<br />
2<br />
0<br />
0<br />
0<br />
0<br />
19<br />
8<br />
10<br />
5<br />
2<br />
1<br />
5<br />
9<br />
21<br />
Total 93 7 100 100<br />
0<br />
0<br />
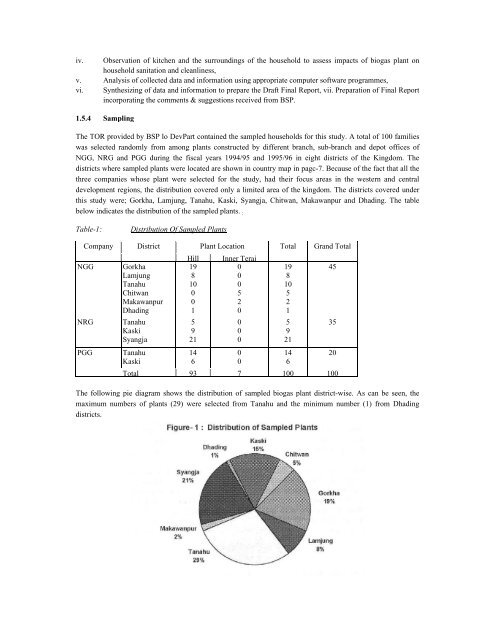
The following pie diagram shows the distribution of sampled biogas plant district-wise. As can be seen, the<br />
maximum numbers of plants (29) were selected from Tanahu and the minimum number (1) from Dhading<br />
districts.<br />
14<br />
6<br />
45<br />
35<br />
20