download (pdf, 11MB) - SNV
download (pdf, 11MB) - SNV
download (pdf, 11MB) - SNV

You also want an ePaper? Increase the reach of your titles
YUMPU automatically turns print PDFs into web optimized ePapers that Google loves.
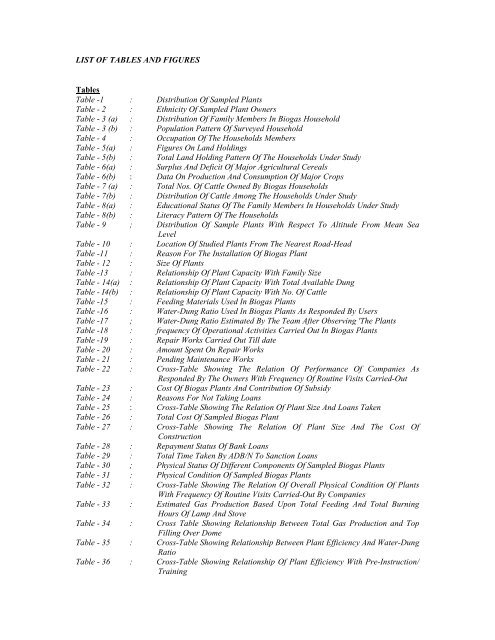
LIST OF TABLES AND FIGURES<br />
Tables<br />
Table -1 : Distribution Of Sampled Plants<br />
Table - 2 : Ethnicity Of Sampled Plant Owners<br />
Table - 3 (a) : Distribution Of Family Members In Biogas Household<br />
Table - 3 (b) : Population Pattern Of Surveyed Household<br />
Table - 4 : Occupation Of The Households Members<br />
Table - 5(a) : Figures On Land Holdings<br />
Table - 5(b) : Total Land Holding Pattern Of The Households Under Study<br />
Table - 6(a) : Surplus And Deficit Of Major Agricultural Cereals<br />
Table - 6(b) : Data On Production And Consumption Of Major Crops<br />
Table - 7 (a) : Total Nos. Of Cattle Owned By Biogas Households<br />
Table - 7(b) : Distribution Of Cattle Among The Households Under Study<br />
Table - 8(a) : Educational Status Of The Family Members In Households Under Study<br />
Table - 8(b) : Literacy Pattern Of The Households<br />
Table - 9 ; Distribution Of Sample Plants With Respect To Altitude From Mean Sea<br />
Level<br />
Table - 10 : Location Of Studied Plants From The Nearest Road-Head<br />
Table -11 : Reason For The Installation Of Biogas Plant<br />
Table - 12 : Size Of Plants<br />
Table -13 : Relationship Of Plant Capacity With Family Size<br />
Table - 14(a) : Relationship Of Plant Capacity With Total Available Dung<br />
Table - I4(b) : Relationship Of Plant Capacity With No. Of Cattle<br />
Table -15 : Feeding Materials Used In Biogas Plants<br />
Table -16 : Water-Dung Ratio Used In Biogas Plants As Responded By Users<br />
Table -17 ; Water-Dung Ratio Estimated By The Team After Observing 'The Plants<br />
Table -18 : frequency Of Operational Activities Carried Out In Biogas Plants<br />
Table -19 : Repair Works Carried Out Till date<br />
Table - 20 : Amount Spent On Repair Works<br />
Table - 21 : Pending Maintenance Works<br />
Table - 22 : Cross-Table Showing The Relation Of Performance Of Companies As<br />
Responded By The Owners With Frequency Of Routine Visits Carried-Out<br />
Table - 23 : Cost Of Biogas Plants And Contribution Of Subsidy<br />
Table - 24 : Reasons For Not Taking Loans<br />
Table - 25 : Cross-Table Showing The Relation Of Plant Size And Loans Taken<br />
Table - 26 : Total Cost Of Sampled Biogas Plant<br />
Table - 27 : Cross-Table Showing The Relation Of Plant Size And The Cost Of<br />
Construction<br />
Table - 28 : Repayment Status Of Bank Loans<br />
Table - 29 : Total Time Taken By ADB/N To Sanction Loans<br />
Table - 30 ; Physical Status Of Different Components Of Sampled Biogas Plants<br />
Table - 31 : Physical Condition Of Sampled Biogas Plants<br />
Table - 32 : Cross-Table Showing The Relation Of Overall Physical Condition Of Plants<br />
With Frequency Of Routine Visits Carried-Out By Companies<br />
Table - 33 : Estimated Gas Production Based Upon Total Feeding And Total Burning<br />
Hours Of Lamp And Stove<br />
Table - 34 : Cross Table Showing Relationship Between Total Gas Production and Top<br />
Filling Over Dome<br />
Table - 35 : Cross-Table Showing Relationship Between Plant Efficiency And Water-Dung<br />
Ratio<br />
Table - 36 : Cross-Table Showing Relationship Of Plant Efficiency With Pre-Instruction/<br />
Training