download (pdf, 11MB) - SNV
download (pdf, 11MB) - SNV
download (pdf, 11MB) - SNV

You also want an ePaper? Increase the reach of your titles
YUMPU automatically turns print PDFs into web optimized ePapers that Google loves.
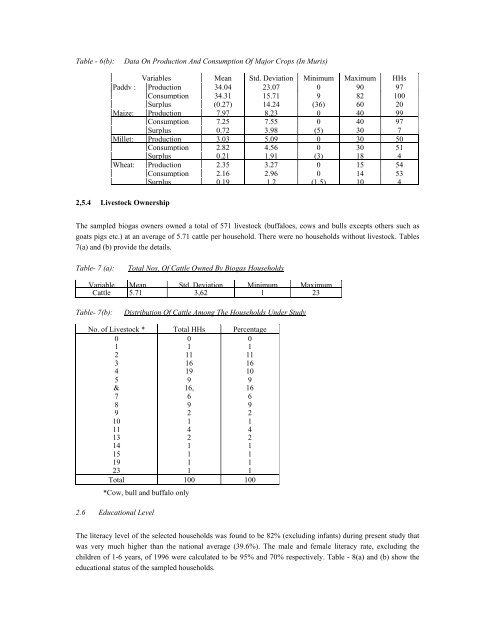
Table - 6(b):<br />
Data On Production And Consumption Of Major Crops (In Muris)<br />
Variables Mean Std. Deviation Minimum Maximum HHs<br />
Paddv : Production 34.04 23.07 0 90 97<br />
Consumption 34.31 15.71 9 82 100<br />
Surplus (0.27) 14.24 (36) 60 20<br />
Maize: Production 7.97 8.23 0 40 99<br />
Consumption 7.25 7.55 0 40 97<br />
Surplus 0.72 3.98 (5) 30 7<br />
Millet: Production 3.03 5.09 0 30 50<br />
Consumption 2.82 4.56 0 30 51<br />
Surplus 0.21 1.91 (3) 18 4<br />
Wheat: Production 2.35 3.27 0 15 54<br />
Consumption 2.16 2.96 0 14 53<br />
Surplus 0.19 1.2 (1.5) 10 4<br />
2,5.4 Livestock Ownership<br />
The sampled biogas owners owned a total of 571 livestock (buffaloes, cows and bulls excepts others such as<br />
goats pigs etc.) at an average of 5.71 cattle per household. There were no households without livestock. Tables<br />
7(a) and (b) provide the details.<br />
Table- 7 (a):<br />
Total Nos, Of Cattle Owned By Biogas Households<br />
Variable Mean Std. Deviation Minimum Maximum<br />
Cattle 5.71 3,62 1 23<br />
Table- 7(b):<br />
Distribution Of Cattle Among The Households Under Study<br />
No. of Livestock * Total HHs Percentage<br />
0 0 0<br />
1 1 1<br />
2 11 11<br />
3 16 16<br />
4 19 10<br />
5 9 9<br />
& 16, 16<br />
7 6 6<br />
8 9 9<br />
9 2 2<br />
10 1 1<br />
11 4 4<br />
13 2 2<br />
14 1 1<br />
15 1 1<br />
19 1 1<br />
23 1 1<br />
Total 100 100<br />
*Cow, bull and buffalo only<br />
2.6 Educational Level<br />
The literacy level of the selected households was found to be 82% (excluding infants) during present study that<br />
was very much higher than the national average (39.6%). The male and female literacy rate, excluding the<br />
children of 1-6 years, of 1996 were calculated to be 95% and 70% respectively. Table - 8(a) and (b) show the<br />
educational status of the sampled households.