download (pdf, 11MB) - SNV
download (pdf, 11MB) - SNV
download (pdf, 11MB) - SNV

Create successful ePaper yourself
Turn your PDF publications into a flip-book with our unique Google optimized e-Paper software.
Table - 41:<br />
Performance Of Plant As Responded By The Users<br />
Performance of Plant<br />
Above Expectation<br />
As Expected<br />
Below Expectation<br />
No. of Respondents<br />
3<br />
78<br />
19<br />
The study team attempted to examine if there was any correlation between the efficiency of biogas plant based<br />
upon the actual gas being received as described in clause 5.2 and the level of users satisfaction as referred in the<br />
above table. The outcome shows that there is no distinct relationship between these two. The results of the<br />
analysis have been illustrated in the following table.<br />
Table - 42 :<br />
Cross-Table Showing The Relation Of Plant Efficiency With Users' Level Of Expectation<br />
Level of<br />
Efficiency of Biogas Plant Based on Gas Received Row<br />
Expectation 80% total<br />
Below Expectation 2 6 8 2 1 19<br />
As Expected 1 18 28 17 19 78<br />
Above Expectation 0 1 1 1 0 3<br />
Column Total 3 25 32 20 20 100<br />
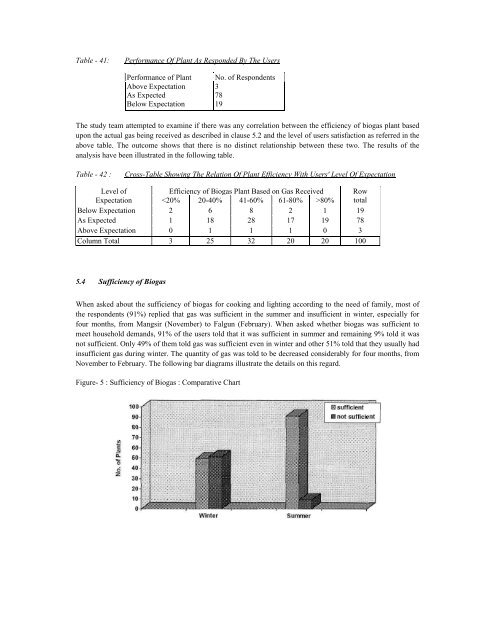
5.4 Sufficiency of Biogas<br />
When asked about the sufficiency of biogas for cooking and lighting according to the need of family, most of<br />
the respondents (91%) replied that gas was sufficient in the summer and insufficient in winter, especially for<br />
four months, from Mangsir (November) to Falgun (February). When asked whether biogas was sufficient to<br />
meet household demands, 91% of the users told that it was sufficient in summer and remaining 9% told it was<br />
not sufficient. Only 49% of them told gas was sufficient even in winter and other 51% told that they usually had<br />
insufficient gas during winter. The quantity of gas was told to be decreased considerably for four months, from<br />
November to February. The following bar diagrams illustrate the details on this regard.<br />
Figure- 5 : Sufficiency of Biogas : Comparative Chart