download (pdf, 11MB) - SNV
download (pdf, 11MB) - SNV
download (pdf, 11MB) - SNV

You also want an ePaper? Increase the reach of your titles
YUMPU automatically turns print PDFs into web optimized ePapers that Google loves.
2.5.2 Land Holding<br />
In rural Nepal, the amount of land holding is the main indicator to assess the economic condition of any family.<br />
In this case, while calculating the land holding, only operational land holdings were taken into account. The land<br />
use and cultivation pattern were observed to be very similar to that of the traditional Nepalese practice. It was<br />
found in most of the cases that land was cultivated by the owner himself. There were very few instances of land<br />
being rented. The average land holding size per family was 23.52 ropani (1.23 ha), which was above the<br />
national land holding size per family being 19.2 ropani or 0.96 ha (source: CBS, National Sample Census of<br />
Agriculture). The figures are shown in table-5(a) and the distribution of land holdings among the sample<br />
household are shown in table-5(b) below. The table shows the distribution of land holdings among sampled<br />
households which is categorized into different groups according to fanners' land holding and the farm size for<br />
different ecological belts are also grouped because of differentiation of land holding ratio as defined by the<br />
HMG/N. The maximum land holding of the visited household was 87 ropanis (4.5 ha) and the minimum was 1.0<br />
ropani (0.05 ha). It illustrates that medium to large land holdings, as reported in previous similar studies, are<br />
associated with most of the plant owners.<br />
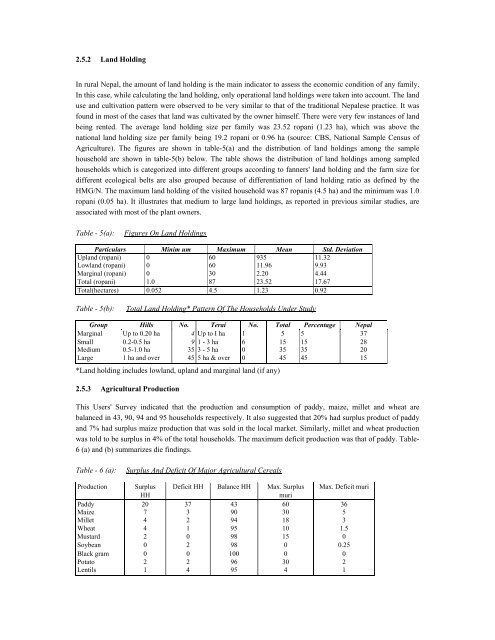
Table - 5(a):<br />
Figures On Land Holdings<br />
Particulars Minim um Maximum Mean Std. Deviation<br />
Upland (ropani) 0 60 935 11.32<br />
Lowland (ropani) 0 60 11.96 9.93<br />
Marginal (ropani) 0 30 2.20 4.44<br />
Total (ropani) 1.0 87 23.52 17.67<br />
Total(hectares) 0.052 4.5 1.23 0.92<br />
Table - 5(b):<br />
Total Land Holding* Pattern Of The Households Under Study<br />
Group Hills No. Terai No. Total Percentage Nepal<br />
Marginal Up to 0.20 ha 4 Up to I ha 1 5 5 37<br />
Small 0.2-0.5 ha 9 1 - 3 ha 6 15 15 28<br />
Medium 0.5-1.0 ha 35 3 - 5 ha 0 35 35 20<br />
Large 1 ha and over 45 5 ha & over 0 45 45 15<br />
*Land holding includes lowland, upland and marginal land (if any)<br />
2.5.3 Agricultural Production<br />
This Users' Survey indicated that the production and consumption of paddy, maize, millet and wheat are<br />
balanced in 43, 90, 94 and 95 households respectively. It also suggested that 20% had surplus product of paddy<br />
and 7% had surplus maize production that was sold in the local market. Similarly, millet and wheat production<br />
was told to be surplus in 4% of the total households. The maximum deficit production was that of paddy. Table-<br />
6 (a) and (b) summarizes die findings.<br />
Table - 6 (a):<br />
Surplus And Deficit Of Major Agricultural Cereals<br />
Production Surplus Deficit HH Balance HH Max. Surplus Max. Deficit muri<br />
HH<br />
muri<br />
Paddy 20 37 43 60 36<br />
Maize 7 3 90 30 5<br />
Millet 4 2 94 18 3<br />
Wheat 4 1 95 10 1.5<br />
Mustard 2 0 98 15 0<br />
Soybean 0 2 98 0 0.25<br />
Black gram 0 0 100 0 0<br />
Potato 2 2 96 30 2<br />
Lentils 1 4 95 4 1