download (pdf, 11MB) - SNV
download (pdf, 11MB) - SNV
download (pdf, 11MB) - SNV

You also want an ePaper? Increase the reach of your titles
YUMPU automatically turns print PDFs into web optimized ePapers that Google loves.
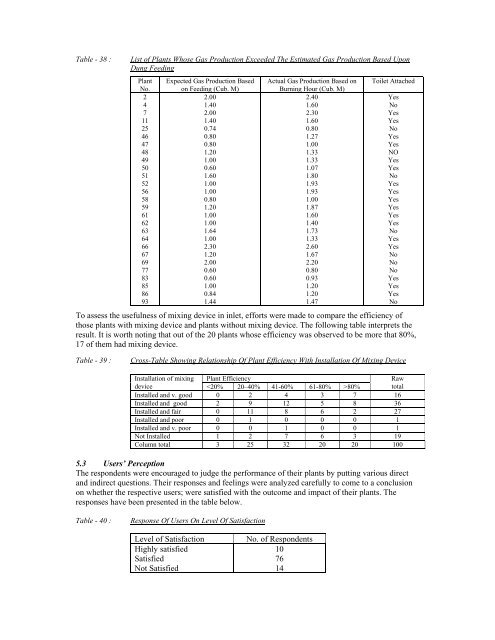
Table - 38 :<br />
List of Plants Whose Gas Production Exceeded The Estimated Gas Production Based Upon<br />
Dung Feeding<br />
Plant<br />
No.<br />
2<br />
4<br />
7<br />
11<br />
25<br />
46<br />
47<br />
48<br />
49<br />
50<br />
51<br />
52<br />
56<br />
58<br />
59<br />
61<br />
62<br />
63<br />
64<br />
66<br />
67<br />
69<br />
77<br />
83<br />
85<br />
86<br />
93<br />
Expected Gas Production Based<br />
on Feeding (Cub. M)<br />
2.00<br />
1.40<br />
2.00<br />
1.40<br />
0.74<br />
0.80<br />
0.80<br />
1.20<br />
1.00<br />
0.60<br />
1.60<br />
1.00<br />
1.00<br />
0.80<br />
1.20<br />
1.00<br />
1.00<br />
1.64<br />
1.00<br />
2.30<br />
1.20<br />
2.00<br />
0.60<br />
0.60<br />
1.00<br />
0.84<br />
1.44<br />
Actual Gas Production Based on<br />
Burning Hour (Cub. M)<br />
2.40<br />
1.60<br />
2.30<br />
1.60<br />
0.80<br />
1.27<br />
1.00<br />
1.33<br />
1.33<br />
1.07<br />
1.80<br />
1.93<br />
1.93<br />
1.00<br />
1.87<br />
1.60<br />
1.40<br />
1.73<br />
1.33<br />
2.60<br />
1.67<br />
2.20<br />
0.80<br />
0.93<br />
1.20<br />
1.20<br />
1.47<br />
Toilet Attached<br />
To assess the usefulness of mixing device in inlet, efforts were made to compare the efficiency of<br />
those plants with mixing device and plants without mixing device. The following table interprets the<br />
result. It is worth noting that out of the 20 plants whose efficiency was observed to be more that 80%,<br />
17 of them had mixing device.<br />
Yes<br />
No<br />
Yes<br />
Yes<br />
No<br />
Yes<br />
Yes<br />
NO<br />
Yes<br />
Yes<br />
No<br />
Yes<br />
Yes<br />
Yes<br />
Yes<br />
Yes<br />
Yes<br />
No<br />
Yes<br />
Yes<br />
No<br />
No<br />
No<br />
Yes<br />
Yes<br />
Yes<br />
No<br />
Table - 39 :<br />
Cross-Table Showing Relationship Of Plant Efficiency With Installation Of Mixing Device<br />
Installation of mixing Plant Efficiency<br />
Raw<br />
device 80% total<br />
Installed and v. good 0 2 4 3 7 16<br />
Installed and good 2 9 12 5 8 36<br />
Installed and fair 0 11 8 6 2 27<br />
Installed and poor 0 1 0 0 0 1<br />
Installed and v. poor 0 0 1 0 0 1<br />
Not Installed 1 2 7 6 3 19<br />
Column total 3 25 32 20 20 100<br />
5.3 Users’ Perception<br />
The respondents were encouraged to judge the performance of their plants by putting various direct<br />
and indirect questions. Their responses and feelings were analyzed carefully to come to a conclusion<br />
on whether the respective users; were satisfied with the outcome and impact of their plants. The<br />
responses have been presented in the table below.<br />
Table - 40 :<br />
Response Of Users On Level Of Satisfaction<br />
Level of Satisfaction<br />
Highly satisfied<br />
Satisfied<br />
Not Satisfied<br />
No. of Respondents<br />
10<br />
76<br />
14