

qreg - Stata
qreg - Stata
qreg - Stata

You also want an ePaper? Increase the reach of your titles
YUMPU automatically turns print PDFs into web optimized ePapers that Google loves.
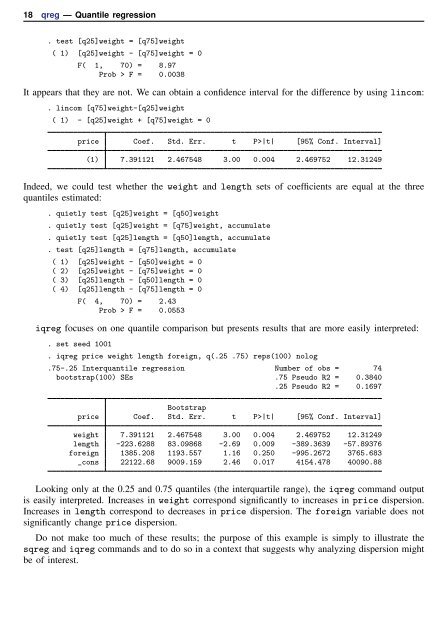
18 <strong>qreg</strong> — Quantile regression<br />
. test [q25]weight = [q75]weight<br />
( 1) [q25]weight - [q75]weight = 0<br />
F( 1, 70) = 8.97<br />
Prob > F = 0.0038<br />
It appears that they are not. We can obtain a confidence interval for the difference by using lincom:<br />
. lincom [q75]weight-[q25]weight<br />
( 1) - [q25]weight + [q75]weight = 0<br />
price Coef. Std. Err. t P>|t| [95% Conf. Interval]<br />
(1) 7.391121 2.467548 3.00 0.004 2.469752 12.31249<br />
Indeed, we could test whether the weight and length sets of coefficients are equal at the three<br />
quantiles estimated:<br />
. quietly test [q25]weight = [q50]weight<br />
. quietly test [q25]weight = [q75]weight, accumulate<br />
. quietly test [q25]length = [q50]length, accumulate<br />
. test [q25]length = [q75]length, accumulate<br />
( 1) [q25]weight - [q50]weight = 0<br />
( 2) [q25]weight - [q75]weight = 0<br />
( 3) [q25]length - [q50]length = 0<br />
( 4) [q25]length - [q75]length = 0<br />
F( 4, 70) = 2.43<br />
Prob > F = 0.0553<br />
i<strong>qreg</strong> focuses on one quantile comparison but presents results that are more easily interpreted:<br />
. set seed 1001<br />
. i<strong>qreg</strong> price weight length foreign, q(.25 .75) reps(100) nolog<br />
.75-.25 Interquantile regression Number of obs = 74<br />
bootstrap(100) SEs .75 Pseudo R2 = 0.3840<br />
.25 Pseudo R2 = 0.1697<br />
Bootstrap<br />
price Coef. Std. Err. t P>|t| [95% Conf. Interval]<br />
weight 7.391121 2.467548 3.00 0.004 2.469752 12.31249<br />
length -223.6288 83.09868 -2.69 0.009 -389.3639 -57.89376<br />
foreign 1385.208 1193.557 1.16 0.250 -995.2672 3765.683<br />
_cons 22122.68 9009.159 2.46 0.017 4154.478 40090.88<br />
Looking only at the 0.25 and 0.75 quantiles (the interquartile range), the i<strong>qreg</strong> command output<br />
is easily interpreted. Increases in weight correspond significantly to increases in price dispersion.<br />
Increases in length correspond to decreases in price dispersion. The foreign variable does not<br />
significantly change price dispersion.<br />
Do not make too much of these results; the purpose of this example is simply to illustrate the<br />
s<strong>qreg</strong> and i<strong>qreg</strong> commands and to do so in a context that suggests why analyzing dispersion might<br />
be of interest.


