

qreg - Stata
qreg - Stata
qreg - Stata

You also want an ePaper? Increase the reach of your titles
YUMPU automatically turns print PDFs into web optimized ePapers that Google loves.
22 <strong>qreg</strong> — Quantile regression<br />
Example 8<br />
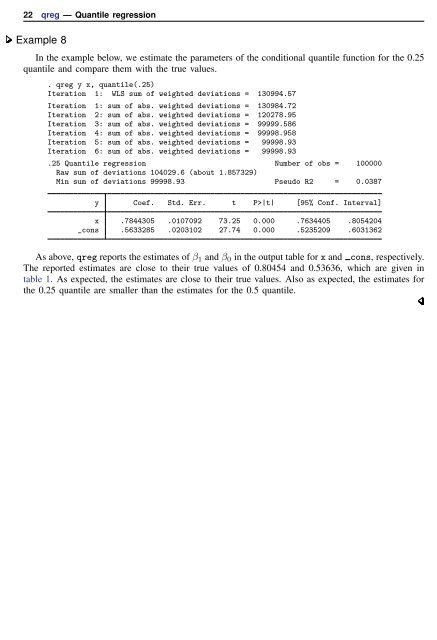
In the example below, we estimate the parameters of the conditional quantile function for the 0.25<br />
quantile and compare them with the true values.<br />
. <strong>qreg</strong> y x, quantile(.25)<br />
Iteration 1: WLS sum of weighted deviations = 130994.57<br />
Iteration 1: sum of abs. weighted deviations = 130984.72<br />
Iteration 2: sum of abs. weighted deviations = 120278.95<br />
Iteration 3: sum of abs. weighted deviations = 99999.586<br />
Iteration 4: sum of abs. weighted deviations = 99998.958<br />
Iteration 5: sum of abs. weighted deviations = 99998.93<br />
Iteration 6: sum of abs. weighted deviations = 99998.93<br />
.25 Quantile regression Number of obs = 100000<br />
Raw sum of deviations 104029.6 (about 1.857329)<br />
Min sum of deviations 99998.93 Pseudo R2 = 0.0387<br />
y Coef. Std. Err. t P>|t| [95% Conf. Interval]<br />
x .7844305 .0107092 73.25 0.000 .7634405 .8054204<br />
_cons .5633285 .0203102 27.74 0.000 .5235209 .6031362<br />
As above, <strong>qreg</strong> reports the estimates of β 1 and β 0 in the output table for x and cons, respectively.<br />
The reported estimates are close to their true values of 0.80454 and 0.53636, which are given in<br />
table 1. As expected, the estimates are close to their true values. Also as expected, the estimates for<br />
the 0.25 quantile are smaller than the estimates for the 0.5 quantile.


