

Post-enumeration Survey (PES) - Statistics South Africa
Post-enumeration Survey (PES) - Statistics South Africa
Post-enumeration Survey (PES) - Statistics South Africa

Create successful ePaper yourself
Turn your PDF publications into a flip-book with our unique Google optimized e-Paper software.
<strong>Statistics</strong> <strong>South</strong> <strong>Africa</strong><br />
31<br />
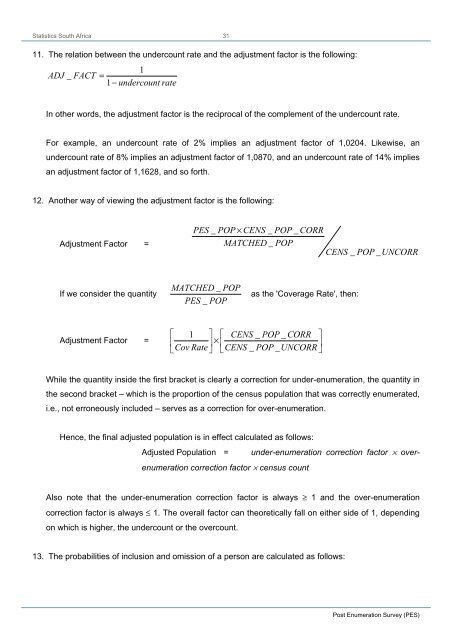
11. The relation between the undercount rate and the adjustment factor is the following:<br />
1<br />
ADJ _ FACT = 1 − undercount rate<br />
In other words, the adjustment factor is the reciprocal of the complement of the undercount rate.<br />
For example, an undercount rate of 2% implies an adjustment factor of 1,0204. Likewise, an<br />
undercount rate of 8% implies an adjustment factor of 1,0870, and an undercount rate of 14% implies<br />
an adjustment factor of 1,1628, and so forth.<br />
12. Another way of viewing the adjustment factor is the following:<br />
Adjustment Factor =<br />
<strong>PES</strong> _ POP × CENS _ POP _ CORR<br />
MATCHED _ POP<br />
CENS _ POP _ UNCORR<br />
If we consider the quantity<br />
MATCHED _ POP<br />
<strong>PES</strong> _ POP<br />
as the 'Coverage Rate', then:<br />
⎡ 1 ⎤ ⎡<br />
⎤<br />
Adjustment Factor = ⎥ × CENS _ POP _ CORR<br />
⎢<br />
⎢<br />
⎥<br />
⎣Cov<br />
Rate⎦<br />
⎣CENS<br />
_ POP _ UNCORR ⎦<br />
While the quantity inside the first bracket is clearly a correction for under-<strong>enumeration</strong>, the quantity in<br />
the second bracket – which is the proportion of the census population that was correctly enumerated,<br />
i.e., not erroneously included – serves as a correction for over-<strong>enumeration</strong>.<br />
Hence, the final adjusted population is in effect calculated as follows:<br />
Adjusted Population = under-<strong>enumeration</strong> correction factor × over<strong>enumeration</strong><br />
correction factor × census count<br />
Also note that the under-<strong>enumeration</strong> correction factor is always ≥ 1 and the over-<strong>enumeration</strong><br />
correction factor is always ≤ 1. The overall factor can theoretically fall on either side of 1, depending<br />
on which is higher, the undercount or the overcount.<br />
13. The probabilities of inclusion and omission of a person are calculated as follows:<br />
<strong>Post</strong> Enumeration <strong>Survey</strong> (<strong>PES</strong>)


