Post-enumeration Survey (PES) - Statistics South Africa
Post-enumeration Survey (PES) - Statistics South Africa
Post-enumeration Survey (PES) - Statistics South Africa
Create successful ePaper yourself
Turn your PDF publications into a flip-book with our unique Google optimized e-Paper software.
<strong>Statistics</strong> <strong>South</strong> <strong>Africa</strong><br />
vi<br />
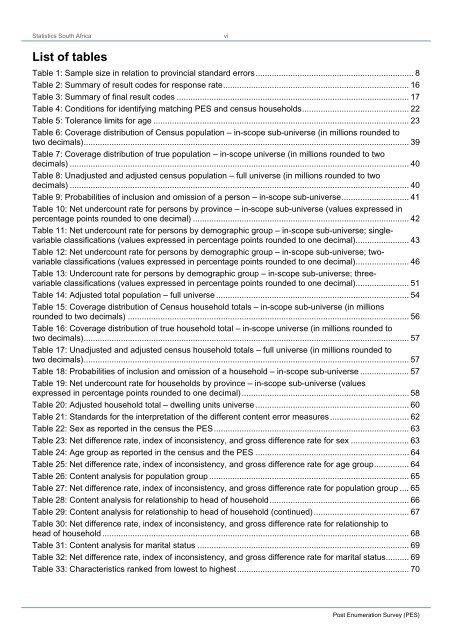
List of tables<br />
Table 1: Sample size in relation to provincial standard errors .................................................................... 8<br />
Table 2: Summary of result codes for response rate ................................................................................ 16<br />
Table 3: Summary of final result codes .................................................................................................... 17<br />
Table 4: Conditions for identifying matching <strong>PES</strong> and census households .............................................. 22<br />
Table 5: Tolerance limits for age .............................................................................................................. 23<br />
Table 6: Coverage distribution of Census population – in-scope sub-universe (in millions rounded to<br />
two decimals) ............................................................................................................................................ 39<br />
Table 7: Coverage distribution of true population – in-scope universe (in millions rounded to two<br />
decimals) .................................................................................................................................................. 40<br />
Table 8: Unadjusted and adjusted census population – full universe (in millions rounded to two<br />
decimals) .................................................................................................................................................. 40<br />
Table 9: Probabilities of inclusion and omission of a person – in-scope sub-universe ............................. 41<br />
Table 10: Net undercount rate for persons by province – in-scope sub-universe (values expressed in<br />
percentage points rounded to one decimal) ............................................................................................. 42<br />
Table 11: Net undercount rate for persons by demographic group – in-scope sub-universe; singlevariable<br />
classifications (values expressed in percentage points rounded to one decimal) ....................... 43<br />
Table 12: Net undercount rate for persons by demographic group – in-scope sub-universe; twovariable<br />
classifications (values expressed in percentage points rounded to one decimal) ....................... 46<br />
Table 13: Undercount rate for persons by demographic group – in-scope sub-universe; threevariable<br />
classifications (values expressed in percentage points rounded to one decimal) ....................... 51<br />
Table 14: Adjusted total population – full universe ................................................................................... 54<br />
Table 15: Coverage distribution of Census household totals – in-scope sub-universe (in millions<br />
rounded to two decimals) ......................................................................................................................... 56<br />
Table 16: Coverage distribution of true household total – in-scope universe (in millions rounded to<br />
two decimals) ............................................................................................................................................ 57<br />
Table 17: Unadjusted and adjusted census household totals – full universe (in millions rounded to<br />
two decimals) ............................................................................................................................................ 57<br />
Table 18: Probabilities of inclusion and omission of a household – in-scope sub-universe ..................... 57<br />
Table 19: Net undercount rate for households by province – in-scope sub-universe (values<br />
expressed in percentage points rounded to one decimal) ........................................................................ 58<br />
Table 20: Adjusted household total – dwelling units universe .................................................................. 60<br />
Table 21: Standards for the interpretation of the different content error measures .................................. 62<br />
Table 22: Sex as reported in the census the <strong>PES</strong> .................................................................................... 63<br />
Table 23: Net difference rate, index of inconsistency, and gross difference rate for sex ......................... 63<br />
Table 24: Age group as reported in the census and the <strong>PES</strong> .................................................................. 64<br />
Table 25: Net difference rate, index of inconsistency, and gross difference rate for age group ............... 64<br />
Table 26: Content analysis for population group ...................................................................................... 65<br />
Table 27: Net difference rate, index of inconsistency, and gross difference rate for population group .... 65<br />
Table 28: Content analysis for relationship to head of household ............................................................ 66<br />
Table 29: Content analysis for relationship to head of household (continued) ......................................... 67<br />
Table 30: Net difference rate, index of inconsistency, and gross difference rate for relationship to<br />
head of household .................................................................................................................................... 68<br />
Table 31: Content analysis for marital status ........................................................................................... 69<br />
Table 32: Net difference rate, index of inconsistency, and gross difference rate for marital status .......... 69<br />
Table 33: Characteristics ranked from lowest to highest .......................................................................... 70<br />
<strong>Post</strong> Enumeration <strong>Survey</strong> (<strong>PES</strong>)


