<strong>Statistics</strong> <strong>South</strong> <strong>Africa</strong> 47 Table 12: Net undercount rate for persons by demographic group – in-scope sub-universe; twovariable classifications (values expressed in percentage points rounded to one decimal) (concluded) Population group by sex Net undercount rate 95% confidence interval limits Standard error (+ or -) Lower Upper Under 5 years 28,5 2,319 23,92 33,01 5-9 years 29,3 1,427 26,47 32,06 10-14 years 10,9 1,091 8,76 13,04 Other 15-19 years 15,0 1,850 11,40 18,65 20-29 years 25,9 1,235 23,43 28,27 30-44 years 26,3 1,225 23,93 28,73 45-64 years 27,9 2,811 22,44 33,46 65 or more 22,7 4,369 14,18 31,31 Sex by age group Male Under 5 years 15,2 0,161 14,92 15,55 5-9 years 11,3 0,183 10,97 11,69 10-14 years 10,8 0,162 10,52 11,16 15-19 years 12,8 0,169 12,48 13,14 20-29 years 19,7 0,168 19,33 19,99 30-44 years 19,3 0,159 19,02 19,65 45-64 years 14,9 0,180 14,58 15,28 65 or more 11,2 0,217 10,75 11,60 Female Under 5 years 14,9 0,174 14,58 15,26 5-9 years 11,5 0,185 11,14 11,86 10-14 years 11,3 0,171 10,93 11,60 15-19 years 12,6 0,153 12,35 12,94 20-29 years 16,6 0,151 16,29 16,89 30-44 years 14,5 0,137 14,28 14,82 45-64 years 10,5 0,170 10,15 10,82 65 or more 9,1 0,206 8,66 9,47 *Subject to rounding error *The undercount rates for undetermined age groups are excluded from this table Table 12 and Figures 7 to 10 will allow the reader to make many different comparisons based on population group by sex, population group by age, or sex by age. For example, the lack of a differential undercount between males and females holds across all population groups (Figure 11). The same figure also shows that the undercount for both white males and white females is significantly higher than that for all other population groups by sex. White males are significantly more undercounted than all other population group/sex groups, except white females. Finally, except for the difference between black males and coloured females as well as black males and coloured males, there are no other significant differences in undercount among the population group/sex groups. <strong>Post</strong> Enumeration <strong>Survey</strong> (<strong>PES</strong>)
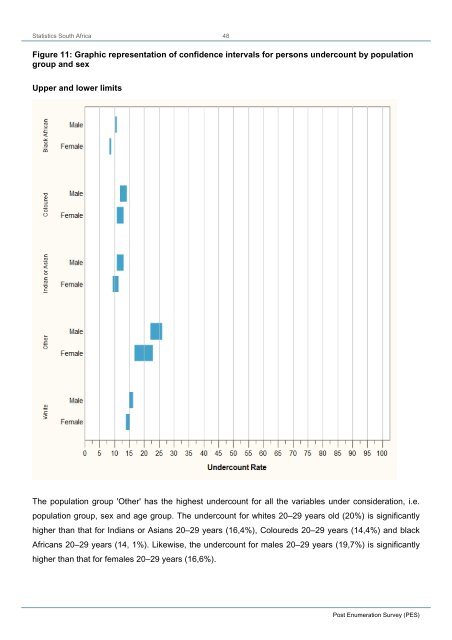
<strong>Statistics</strong> <strong>South</strong> <strong>Africa</strong> 48 Figure 11: Graphic representation of confidence intervals for persons undercount by population group and sex Upper and lower limits The population group 'Other' has the highest undercount for all the variables under consideration, i.e. population group, sex and age group. The undercount for whites 20–29 years old (20%) is significantly higher than that for Indians or Asians 20–29 years (16,4%), Coloureds 20–29 years (14,4%) and black <strong>Africa</strong>ns 20–29 years (14, 1%). Likewise, the undercount for males 20–29 years (19,7%) is significantly higher than that for females 20–29 years (16,6%). <strong>Post</strong> Enumeration <strong>Survey</strong> (<strong>PES</strong>)