

Post-enumeration Survey (PES) - Statistics South Africa
Post-enumeration Survey (PES) - Statistics South Africa
Post-enumeration Survey (PES) - Statistics South Africa

You also want an ePaper? Increase the reach of your titles
YUMPU automatically turns print PDFs into web optimized ePapers that Google loves.
<strong>Statistics</strong> <strong>South</strong> <strong>Africa</strong><br />
54<br />
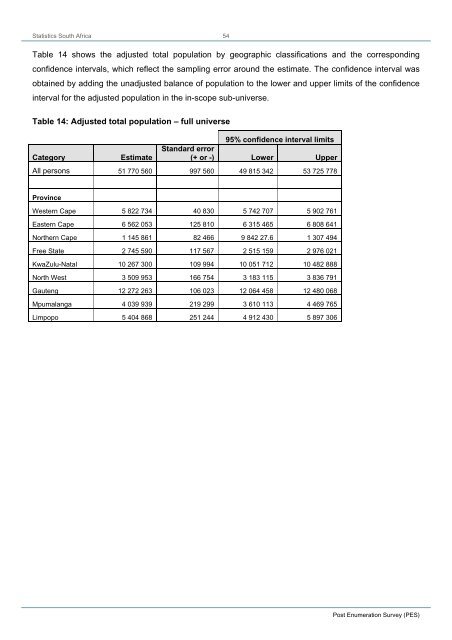
Table 14 shows the adjusted total population by geographic classifications and the corresponding<br />
confidence intervals, which reflect the sampling error around the estimate. The confidence interval was<br />
obtained by adding the unadjusted balance of population to the lower and upper limits of the confidence<br />
interval for the adjusted population in the in-scope sub-universe.<br />
Table 14: Adjusted total population – full universe<br />
95% confidence interval limits<br />
Category<br />
Estimate<br />
Standard error<br />
(+ or -) Lower Upper<br />
All persons 51 770 560 997 560 49 815 342 53 725 778<br />
Province<br />
Western Cape 5 822 734 40 830 5 742 707 5 902 761<br />
Eastern Cape 6 562 053 125 810 6 315 465 6 808 641<br />
Northern Cape 1 145 861 82 466 9 842 27.6 1 307 494<br />
Free State 2 745 590 117 567 2 515 159 2 976 021<br />
KwaZulu-Natal 10 267 300 109 994 10 051 712 10 482 888<br />
North West 3 509 953 166 754 3 183 115 3 836 791<br />
Gauteng 12 272 263 106 023 12 064 458 12 480 068<br />
Mpumalanga 4 039 939 219 299 3 610 113 4 469 765<br />
Limpopo 5 404 868 251 244 4 912 430 5 897 306<br />
<strong>Post</strong> Enumeration <strong>Survey</strong> (<strong>PES</strong>)


