3B Scientific - Physics & Engineering Experiments
3B Scientific - Physics & Engineering Experiments
3B Scientific - Physics & Engineering Experiments
Create successful ePaper yourself
Turn your PDF publications into a flip-book with our unique Google optimized e-Paper software.
UE2060250<br />
Thermodynamics/Heat cycles<br />
Stirling Engine G<br />
UE2060250<br />
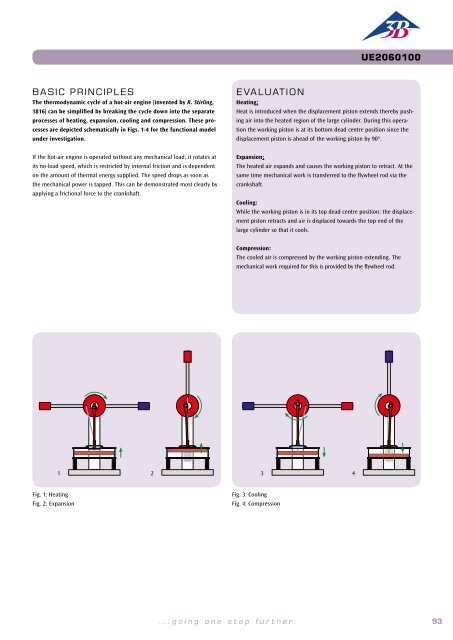
BASIC PRINCIPLES<br />
Cyclic processes in thermodynamics can be plotted as a closed loop in<br />
a p-V diagram. The area enclosed by the curve corresponds to the mechanical<br />
work W taken from the system. Alternatively, the mechanical<br />
power P associated with a complete cycle can be determined and then<br />
the mechanical work can be calculated from that by means of an integration<br />
over time.<br />
EVALUATION<br />
To verify the cyclic process, the measurement results are plotted in a p-V<br />
diagram. In order to determine the mechanical power output, it is plotted<br />
in a second graph as a function of time. On this second graph, it is<br />
easy to identify the cycles of the process. This is important when choosing<br />
the limits for the integration in order to calculate the mechanical<br />
work per cycle, see (2).<br />
The following equations apply:<br />
(1)<br />
W = !∫ pdV <br />
V<br />
or<br />
(2) with<br />
EXPERIMENT<br />
PROCEDURE<br />
• Record a p-V diagram.<br />
• Determine the mechanical power associated<br />
with a full cycle and calculate<br />
the mechanical work.<br />
OBJECTIVE<br />
Record a p-V diagram.<br />
SUMMARY<br />
Cyclic processes in thermodynamics can be plotted as a closed loop in a p-V diagram. The area<br />
enclosed by the curve corresponds to the mechanical work taken from the system. Alternatively, the<br />
mechanical power associated with a complete cycle can be determined and then the mechanical work<br />
can be calculated from that by means of an integration over time. This will be investigated in the<br />
course of an experiment using a Stirling engine.<br />
For the experiment we will choose the second variant to determine the<br />
mechanical power output in each cycle by a glass Stirling engine specifically<br />
designed for educational purposes. To determine the pressure p in the main<br />
cylinder, a relative pressure sensor is fitted, which measures the difference<br />
in cylinder pressure from the ambient pressure. The volume V is calculated<br />
from the distance s travelled by the main piston and its cross-sectional area A.<br />
A displacement sensor is attached to the main piston for this purpose.<br />
Required Apparatus<br />
Quantity Description Number<br />
1 Stirling Engine G 1002594<br />
1 Sensor Holder for Stirling Engine G 1008500<br />
1 Displacement Sensor 1000568<br />
1 Relative Pressure Sensor, ±1000 hPa 1000548<br />
1 <strong>3B</strong> NETlab 1000544<br />
1 <strong>3B</strong> NETlog (230 V, 50/60 Hz) 1000540 or<br />
1 <strong>3B</strong> NETlog (115 V, 50/60 Hz) 1000539<br />
1 DC Power Supply 0 – 20 V, 0 – 5 A (230 V, 50/60 Hz) 1003312 or<br />
1 DC Power Supply 0 – 20 V, 0 – 5 A (115 V, 50/60 Hz) 1003311<br />
1 Pair of Safety Experimental Leads, 75cm, red/blue 1017718<br />
Fig. 1: p-V diagram for Stirling engine G<br />
Fig. 2: p(t), V(t) and P(t) plot for Stirling engine G<br />
2<br />
94 <strong>3B</strong> <strong>Scientific</strong>® <strong>Experiments</strong><br />
...going one step further<br />
95


