Whole report - STUK
Whole report - STUK
Whole report - STUK

Create successful ePaper yourself
Turn your PDF publications into a flip-book with our unique Google optimized e-Paper software.
<strong>STUK</strong>-YTO-TR 175<br />
5 SENSITIVITY TO HORIZONTAL<br />
POSITIONING<br />
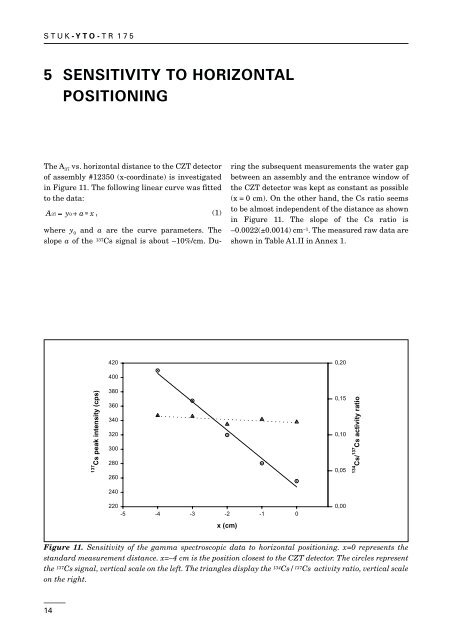
The A 37<br />
vs. horizontal distance to the CZT detector<br />
of assembly #12350 (x-coordinate) is investigated<br />
in Figure 11. The following linear curve was fitted<br />
to the data:<br />
A37 = y0<br />
+ a* x, (1)<br />
where y 0<br />
and a are the curve parameters. The<br />
slope a of the 137 Cs signal is about –10%/cm. Du-<br />
ring the subsequent measurements the water gap<br />
between an assembly and the entrance window of<br />
the CZT detector was kept as constant as possible<br />
(x = 0 cm). On the other hand, the Cs ratio seems<br />
to be almost independent of the distance as shown<br />
in Figure 11. The slope of the Cs ratio is<br />
–0.0022(±0.0014) cm –1 . The measured raw data are<br />
shown in Table A1.II in Annex 1.<br />
420<br />
0,20<br />
137<br />
Cs peak intensity (cps)<br />
400<br />
380<br />
360<br />
340<br />
320<br />
300<br />
280<br />
260<br />
240<br />
220<br />
-5 -4 -3 -2 -1 0<br />
x (cm)<br />
0,15<br />
0,10<br />
0,05<br />
0,00<br />
134<br />
Cs/<br />
137<br />
Cs activity ratio<br />
Figure 11. Sensitivity of the gamma spectroscopic data to horizontal positioning. x=0 represents the<br />
standard measurement distance. x=–4 cm is the position closest to the CZT detector. The circles represent<br />
the 137 Cs signal, vertical scale on the left. The triangles display the 134 Cs/ 137 Cs activity ratio, vertical scale<br />
on the right.<br />
14