Whole report - STUK
Whole report - STUK
Whole report - STUK

Create successful ePaper yourself
Turn your PDF publications into a flip-book with our unique Google optimized e-Paper software.
<strong>STUK</strong>-YTO-TR 175<br />
2000<br />
244<br />
Cm neutron counts (cps)<br />
1000<br />
800<br />
600<br />
400<br />
200<br />
100<br />
80<br />
60<br />
40<br />
20<br />
10<br />
10<br />
15 20 25 30 35 40 45 50<br />
Burnup (MWd/kg)<br />
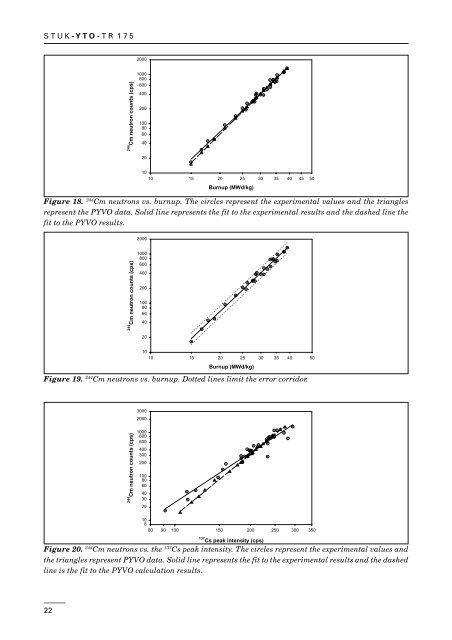
Figure 18. 244 Cm neutrons vs. burnup. The circles represent the experimental values and the triangles<br />
represent the PYVO data. Solid line represents the fit to the experimental results and the dashed line the<br />
fit to the PYVO results.<br />
2000<br />
244<br />
Cm neutron counts (cps)<br />
1000<br />
800<br />
600<br />
400<br />
200<br />
100<br />
80<br />
60<br />
40<br />
20<br />
10<br />
10<br />
15 20 25 30 35 40 50<br />
Burnup (MWd/kg)<br />
Figure 19. 244 Cm neutrons vs. burnup. Dotted lines limit the error corridor.<br />
3000<br />
2000<br />
244<br />
Cm neutron counts (cps)<br />
1000<br />
800<br />
600<br />
400<br />
300<br />
200<br />
100<br />
80<br />
60<br />
40<br />
30<br />
20<br />
10<br />
8<br />
80 90 100<br />
150 200 250 300 350<br />
137 Cs peak intensity (cps)<br />
Figure 20. 244 Cm neutrons vs. the 137 Cs peak intensity. The circles represent the experimental values and<br />
the triangles represent PYVO data. Solid line represents the fit to the experimental results and the dashed<br />
line is the fit to the PYVO calculation results.<br />
22