Whole report - STUK
Whole report - STUK
Whole report - STUK

You also want an ePaper? Increase the reach of your titles
YUMPU automatically turns print PDFs into web optimized ePapers that Google loves.
<strong>STUK</strong>-YTO-TR 175<br />
6.1.3 Correlation of gross gamma to<br />
burnup<br />
A linear fit of the gross gamma data (G 37<br />
) vs. burnup<br />
according to<br />
G k¢¢ B<br />
(10)<br />
37<br />
= *<br />
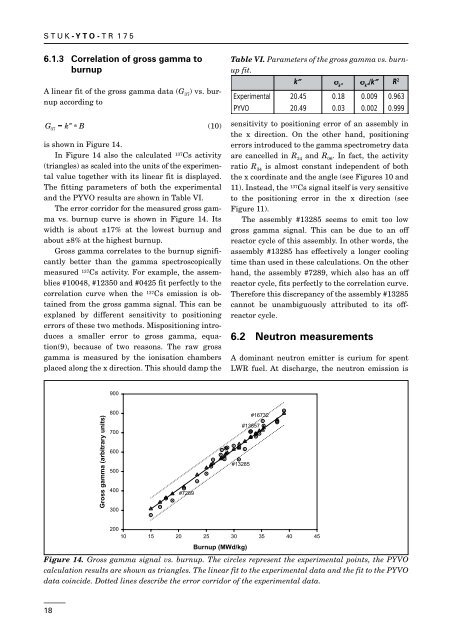
is shown in Figure 14.<br />
In Figure 14 also the calculated 137 Cs activity<br />
(triangles) as scaled into the units of the experimental<br />
value together with its linear fit is displayed.<br />
The fitting parameters of both the experimental<br />
and the PYVO results are shown in Table VI.<br />
The error corridor for the measured gross gamma<br />
vs. burnup curve is shown in Figure 14. Its<br />
width is about ±17% at the lowest burnup and<br />
about ±8% at the highest burnup.<br />
Gross gamma correlates to the burnup significantly<br />
better than the gamma spectroscopically<br />
measured 137 Cs activity. For example, the assemblies<br />
#10048, #12350 and #0425 fit perfectly to the<br />
correlation curve when the 137 Cs emission is obtained<br />
from the gross gamma signal. This can be<br />
explaned by different sensitivity to positioning<br />
errors of these two methods. Mispositioning introduces<br />
a smaller error to gross gamma, equation(9),<br />
because of two reasons. The raw gross<br />
gamma is measured by the ionisation chambers<br />
placed along the x direction. This should damp the<br />
Table VI. Parameters of the gross gamma vs. burnup<br />
fit.<br />
k² s k²<br />
s k²<br />
/k² R 2<br />
Experimental<br />
20.45<br />
0.18<br />
0.009<br />
0.963<br />
PYVO<br />
20.49<br />
0.03<br />
0.002<br />
0.999<br />
sensitivity to positioning error of an assembly in<br />
the x direction. On the other hand, positioning<br />
errors introduced to the gamma spectrometry data<br />
are cancelled in R 34<br />
and R 06<br />
. In fact, the activity<br />
ratio R 34<br />
is almost constant independent of both<br />
the x coordinate and the angle (see Figures 10 and<br />
11). Instead, the 137 Cs signal itself is very sensitive<br />
to the positioning error in the x direction (see<br />
Figure 11).<br />
The assembly #13285 seems to emit too low<br />
gross gamma signal. This can be due to an off<br />
reactor cycle of this assembly. In other words, the<br />
assembly #13285 has effectively a longer cooling<br />
time than used in these calculations. On the other<br />
hand, the assembly #7289, which also has an off<br />
reactor cycle, fits perfectly to the correlation curve.<br />
Therefore this discrepancy of the assembly #13285<br />
cannot be unambiguously attributed to its offreactor<br />
cycle.<br />
6.2 Neutron measurements<br />
A dominant neutron emitter is curium for spent<br />
LWR fuel. At discharge, the neutron emission is<br />
900<br />
Gross gamma (arbitrary units)<br />
800<br />
700<br />
600<br />
500<br />
400<br />
300<br />
#7289<br />
#16732<br />
#13857<br />
#13285<br />
200<br />
10 15 20 25 30 35 40 45<br />
Burnup (MWd/kg)<br />
Figure 14. Gross gamma signal vs. burnup. The circles represent the experimental points, the PYVO<br />
calculation results are shown as triangles. The linear fit to the experimental data and the fit to the PYVO<br />
data coincide. Dotted lines describe the error corridor of the experimental data.<br />
18