Whole report - STUK
Whole report - STUK
Whole report - STUK

Create successful ePaper yourself
Turn your PDF publications into a flip-book with our unique Google optimized e-Paper software.
<strong>STUK</strong>-YTO-TR 175<br />
8 SENSITIVITY TO VERTICAL<br />
POSITIONING<br />
According to Tanskanen's ORIGEN-S calculations<br />
the void fraction has a strong influence on buildup<br />
of 244 Cm in BWR. This implies that for the<br />
same burnup a higher void fraction gives a higher<br />
neutron source. [11] Because of boiling the void<br />
fraction is larger in the upper part than in the<br />
lower part of an assembly. Owing to that, in December<br />
measurements were performed in addition<br />
to the mid-point (z=5705) at two additional heights<br />
6275 and 5135, 570 mm above and below the midpoint.<br />
All measured data points have been taken into<br />
consideration in the following fits. The measured<br />
raw data are shown in Table A1.IV in Annex 1.<br />
The measurement data from all four sides were<br />
averaged and the corrections to the measurement<br />
data, as mentioned in section 6, have been made<br />
for A 37<br />
, gross gamma and neutron data. The analysis<br />
was made using the neutron counts from bare<br />
fission chambers, because the correlation between<br />
Cd-wrapped and bare neutron channels was perfectly<br />
linear.<br />
The operator-declared burnup represents the<br />
average burnup of an assembly. On the other<br />
hand, both the measured gross gamma data and<br />
the spectroscopically obtained 137 Cs intensity reflect<br />
the burnup at the measurement height.<br />
Therefore one could expect that the variations in<br />
the axial burnup profiles, which are clearly seen<br />
in section 7, would influence on the measurement<br />
results.<br />
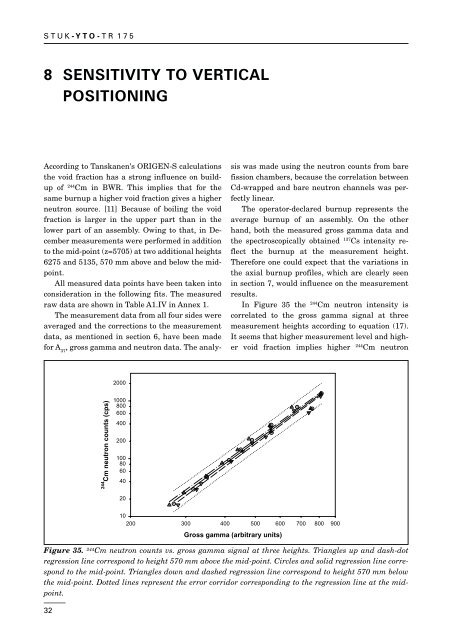
In Figure 35 the 244 Cm neutron intensity is<br />
correlated to the gross gamma signal at three<br />
measurement heights according to equation (17).<br />
It seems that higher measurement level and higher<br />
void fraction implies higher 244 Cm neutron<br />
2000<br />
244<br />
Cm neutron counts (cps)<br />
1000<br />
800<br />
600<br />
400<br />
200<br />
100<br />
80<br />
60<br />
40<br />
20<br />
Figure 35. 244 Cm neutron counts vs. gross gamma signal at three heights. Triangles up and dash-dot<br />
regression line correspond to height 570 mm above the mid-point. Circles and solid regression line correspond<br />
to the mid-point. Triangles down and dashed regression line correspond to height 570 mm below<br />
the mid-point. Dotted lines represent the error corridor corresponding to the regression line at the midpoint.<br />
32<br />
10<br />
200 300 400 500 600 700 800 900<br />
Gross gamma (arbitrary units)