Whole report - STUK
Whole report - STUK
Whole report - STUK

You also want an ePaper? Increase the reach of your titles
YUMPU automatically turns print PDFs into web optimized ePapers that Google loves.
<strong>STUK</strong>-YTO-TR 175<br />
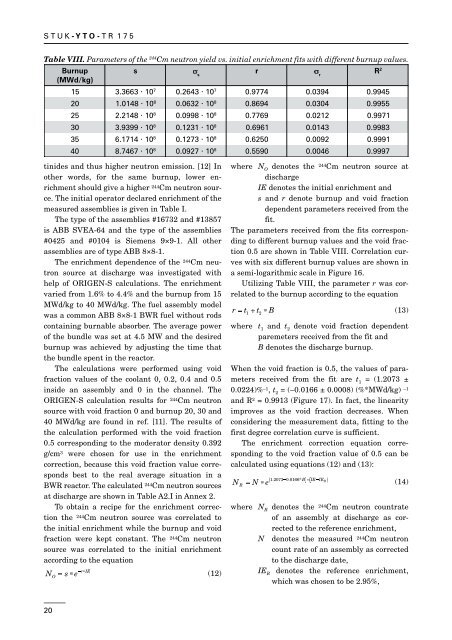
Table VIII. Parameters of the 244 Cm neutron yield vs. initial enrichment fits with different burnup values.<br />
Burnup<br />
(MWd/kg)<br />
s s s<br />
r s r<br />
R 2<br />
7 7<br />
15<br />
3.3663<br />
· 10<br />
0.2643<br />
· 10<br />
0.9774<br />
0.0394<br />
0.9945<br />
20<br />
8<br />
1.0148<br />
· 10<br />
8<br />
0.0632<br />
· 10<br />
0.8694<br />
0.0304<br />
0.9955<br />
25<br />
8<br />
2.2148<br />
· 10<br />
8<br />
0.0998<br />
· 10<br />
0.7769<br />
0.0212<br />
0.9971<br />
30<br />
8<br />
3.9399<br />
· 10<br />
8<br />
0.1231<br />
· 10<br />
0.6961<br />
0.0143<br />
0.9983<br />
35<br />
8<br />
6.1714<br />
· 10<br />
8<br />
0.1273<br />
· 10<br />
0.6250<br />
0.0092<br />
0.9991<br />
8 8<br />
40<br />
8.7467<br />
· 10<br />
0.0927<br />
· 10<br />
0.5590<br />
0.0046<br />
0.9997<br />
tinides and thus higher neutron emission. [12] In<br />
other words, for the same burnup, lower enrichment<br />
should give a higher 244 Cm neutron source.<br />
The initial operator declared enrichment of the<br />
measured assemblies is given in Table I.<br />
The type of the assemblies #16732 and #13857<br />
is ABB SVEA-64 and the type of the assemblies<br />
#0425 and #0104 is Siemens 9×9-1. All other<br />
assemblies are of type ABB 8×8-1.<br />
The enrichment dependence of the 244 Cm neutron<br />
source at discharge was investigated with<br />
help of ORIGEN-S calculations. The enrichment<br />
varied from 1.6% to 4.4% and the burnup from 15<br />
MWd/kg to 40 MWd/kg. The fuel assembly model<br />
was a common ABB 8×8-1 BWR fuel without rods<br />
containing burnable absorber. The average power<br />
of the bundle was set at 4.5 MW and the desired<br />
burnup was achieved by adjusting the time that<br />
the bundle spent in the reactor.<br />
The calculations were performed using void<br />
fraction values of the coolant 0, 0.2, 0.4 and 0.5<br />
inside an assembly and 0 in the channel. The<br />
ORIGEN-S calculation results for 244 Cm neutron<br />
source with void fraction 0 and burnup 20, 30 and<br />
40 MWd/kg are found in ref. [11]. The results of<br />
the calculation performed with the void fraction<br />
0.5 corresponding to the moderator density 0.392<br />
g/cm 3 were chosen for use in the enrichment<br />
correction, because this void fraction value corresponds<br />
best to the real average situation in a<br />
BWR reactor. The calculated 244 Cm neutron sources<br />
at discharge are shown in Table A2.I in Annex 2.<br />
To obtain a recipe for the enrichment correction<br />
the 244 Cm neutron source was correlated to<br />
the initial enrichment while the burnup and void<br />
fraction were kept constant. The 244 Cm neutron<br />
source was correlated to the initial enrichment<br />
according to the equation<br />
N s e - *<br />
r IE<br />
O<br />
= * (12)<br />
where N O<br />
denotes the 244 Cm neutron source at<br />
discharge<br />
IE denotes the initial enrichment and<br />
s and r denote burnup and void fraction<br />
dependent parameters received from the<br />
fit.<br />
The parameters received from the fits corresponding<br />
to different burnup values and the void fraction<br />
0.5 are shown in Table VIII. Correlation curves<br />
with six different burnup values are shown in<br />
a semi-logarithmic scale in Figure 16.<br />
Utilizing Table VIII, the parameter r was correlated<br />
to the burnup according to the equation<br />
r = t1 + t2<br />
* B<br />
(13)<br />
where t 1<br />
and t 2<br />
denote void fraction dependent<br />
paremeters received from the fit and<br />
B denotes the discharge burnup.<br />
When the void fraction is 0.5, the values of parameters<br />
received from the fit are t 1<br />
= (1.2073 ±<br />
0.0224)% –1 , t 2<br />
= (–0.0166 ± 0.0008) (%*MWd/kg) –1<br />
and R 2 = 0.9913 (Figure 17). In fact, the linearity<br />
improves as the void fraction decreases. When<br />
considering the measurement data, fitting to the<br />
first degree correlation curve is sufficient.<br />
The enrichment correction equation corresponding<br />
to the void fraction value of 0.5 can be<br />
calculated using equations (12) and (13):<br />
N N e<br />
R<br />
= *<br />
( 1.2073- 0.0166* B) *( IE-IER<br />
(14)<br />
)<br />
where N R<br />
denotes the 244 Cm neutron countrate<br />
of an assembly at discharge as corrected<br />
to the reference enrichment,<br />
N denotes the measured 244 Cm neutron<br />
count rate of an assembly as corrected<br />
to the discharge date,<br />
IE R<br />
denotes the reference enrichment,<br />
which was chosen to be 2.95%,<br />
20