Whole report - STUK
Whole report - STUK
Whole report - STUK

You also want an ePaper? Increase the reach of your titles
YUMPU automatically turns print PDFs into web optimized ePapers that Google loves.
<strong>STUK</strong>-YTO-TR 175<br />
4e+8<br />
4e+8<br />
3e+8<br />
Neutron source<br />
3e+8<br />
2e+8<br />
2e+8<br />
1e+8<br />
5e+7<br />
0<br />
0 1000 2000 3000 4000<br />
bottom<br />
top<br />
Vertical position (mm)<br />
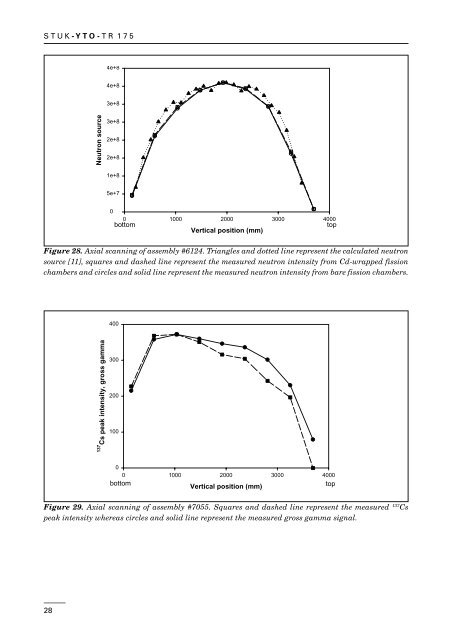
Figure 28. Axial scanning of assembly #6124. Triangles and dotted line represent the calculated neutron<br />
source [11], squares and dashed line represent the measured neutron intensity from Cd-wrapped fission<br />
chambers and circles and solid line represent the measured neutron intensity from bare fission chambers.<br />
400<br />
137<br />
Cs peak intensity, gross gamma<br />
300<br />
200<br />
100<br />
0<br />
0 1000 2000 3000 4000<br />
bottom<br />
Vertical position (mm)<br />
top<br />
Figure 29. Axial scanning of assembly #7055. Squares and dashed line represent the measured 137 Cs<br />
peak intensity whereas circles and solid line represent the measured gross gamma signal.<br />
28