Whole report - STUK
Whole report - STUK
Whole report - STUK

You also want an ePaper? Increase the reach of your titles
YUMPU automatically turns print PDFs into web optimized ePapers that Google loves.
<strong>STUK</strong>-YTO-TR 175<br />
±1.1% to ±18.7%, when all measurements are<br />
taken into consideration.<br />
6.4 Comparison of MMCA and<br />
DART, CsRatio and SAMPO<br />
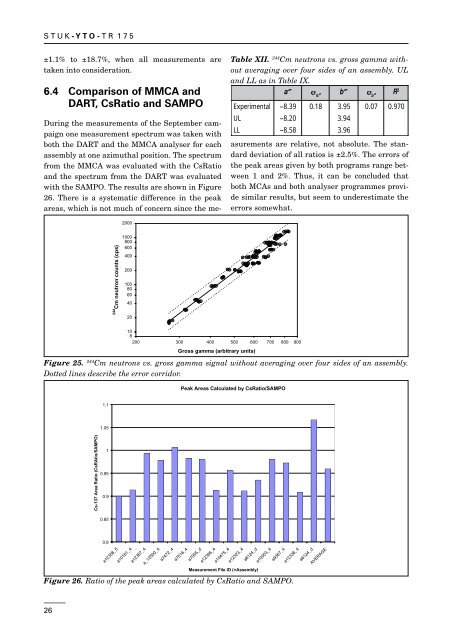
During the measurements of the September campaign<br />
one measurement spectrum was taken with<br />
both the DART and the MMCA analyser for each<br />
assembly at one azimuthal position. The spectrum<br />
from the MMCA was evaluated with the CsRatio<br />
and the spectrum from the DART was evaluated<br />
with the SAMPO. The results are shown in Figure<br />
26. There is a systematic difference in the peak<br />
areas, which is not much of concern since the me-<br />
Table XII. 244 Cm neutrons vs. gross gamma without<br />
averaging over four sides of an assembly. UL<br />
and LL as in Table IX.<br />
a² s b²<br />
a²<br />
s<br />
b²<br />
R 2<br />
Experimental<br />
– 8.39<br />
0.18<br />
3.95<br />
0.07<br />
0.970<br />
UL<br />
– 8.20<br />
3.94<br />
LL<br />
– 8.58<br />
3.96<br />
asurements are relative, not absolute. The standard<br />
deviation of all ratios is ±2.5%. The errors of<br />
the peak areas given by both programs range between<br />
1 and 2%. Thus, it can be concluded that<br />
both MCAs and both analyser programmes provide<br />
similar results, but seem to underestimate the<br />
errors somewhat.<br />
2000<br />
244<br />
Cm neutron counts (cps)<br />
1000<br />
800<br />
600<br />
400<br />
200<br />
100<br />
80<br />
60<br />
40<br />
20<br />
10<br />
8<br />
200 300 400 500 600 700 800 900<br />
Gross gamma (arbitrary units)<br />
Figure 25. 244 Cm neutrons vs. gross gamma signal without averaging over four sides of an assembly.<br />
Dotted lines describe the error corridor.<br />
Peak Areas Calculated by CsRatio/SAMPO<br />
1.1<br />
1.05<br />
Cs-137 Area Ratio (CsRAtio/SAMPO)<br />
1<br />
0.95<br />
0.9<br />
0.85<br />
0.8<br />
a12358_5<br />
a10181_4<br />
a12387_4<br />
a_12500_4<br />
a7472_4<br />
a7516_4<br />
a7055_d<br />
a12366_4<br />
a10475_4<br />
a12323_4<br />
Figure 26. Ratio of the peak areas calculated by CsRatio and SAMPO.<br />
a6124_d<br />
Measurement File ID (=Assembly)<br />
a10003_4<br />
a9367_4<br />
a12338_4<br />
a6124_d<br />
AVERAGE<br />
26