

N2O production in a single stage nitritation/anammox MBBR process
N2O production in a single stage nitritation/anammox MBBR process
N2O production in a single stage nitritation/anammox MBBR process

You also want an ePaper? Increase the reach of your titles
YUMPU automatically turns print PDFs into web optimized ePapers that Google loves.
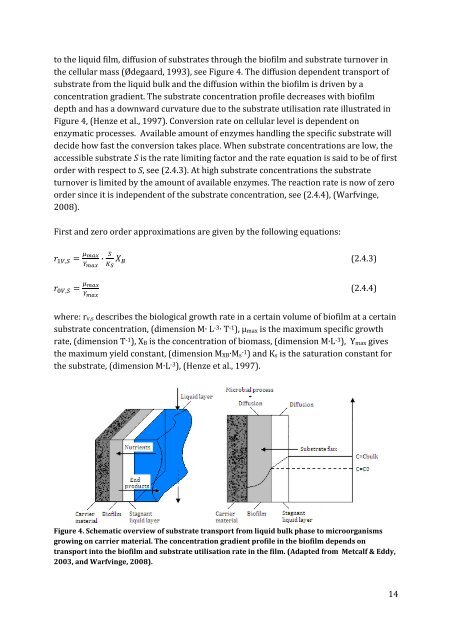
to the liquid film, diffusion of substrates through the biofilm and substrate turnover <strong>in</strong><br />
the cellular mass (Ødegaard, 1993), see Figure 4. The diffusion dependent transport of<br />
substrate from the liquid bulk and the diffusion with<strong>in</strong> the biofilm is driven by a<br />
concentration gradient. The substrate concentration profile decreases with biofilm<br />
depth and has a downward curvature due to the substrate utilisation rate illustrated <strong>in</strong><br />
Figure 4, (Henze et al., 1997). Conversion rate on cellular level is dependent on<br />
enzymatic <strong>process</strong>es. Available amount of enzymes handl<strong>in</strong>g the specific substrate will<br />
decide how fast the conversion takes place. When substrate concentrations are low, the<br />
accessible substrate S is the rate limit<strong>in</strong>g factor and the rate equation is said to be of first<br />
order with respect to S, see (2.4.3). At high substrate concentrations the substrate<br />
turnover is limited by the amount of available enzymes. The reaction rate is now of zero<br />
order s<strong>in</strong>ce it is <strong>in</strong>dependent of the substrate concentration, see (2.4.4), (Warfv<strong>in</strong>ge,<br />
2008).<br />
First and zero order approximations are given by the follow<strong>in</strong>g equations:<br />
, <br />
<br />
· <br />
<br />
(2.4.3)<br />
, <br />
<br />
(2.4.4)<br />
where: rv,s describes the biological growth rate <strong>in</strong> a certa<strong>in</strong> volume of biofilm at a certa<strong>in</strong><br />
substrate concentration, (dimension M∙ L -3 ∙ T -1 ), µmax is the maximum specific growth<br />
rate, (dimension T -1 ), XB is the concentration of biomass, (dimension M∙L -3 ), Ymax gives<br />
the maximum yield constant, (dimension MXB∙Ms -1 ) and Ks is the saturation constant for<br />
the substrate, (dimension M∙L -3 ), (Henze et al., 1997).<br />
Figure 4. Schematic overview of substrate transport from liquid bulk phase to microorganisms<br />
grow<strong>in</strong>g on carrier material. The concentration gradient profile <strong>in</strong> the biofilm depends on<br />
transport <strong>in</strong>to the biofilm and substrate utilisation rate <strong>in</strong> the film. (Adapted from Metcalf & Eddy,<br />
2003, and Warfv<strong>in</strong>ge, 2008).<br />
14


