

N2O production in a single stage nitritation/anammox MBBR process
N2O production in a single stage nitritation/anammox MBBR process
N2O production in a single stage nitritation/anammox MBBR process

You also want an ePaper? Increase the reach of your titles
YUMPU automatically turns print PDFs into web optimized ePapers that Google loves.
4.4 NO2-N biosensor<br />
The biosensor was used to register changes <strong>in</strong> NO2-N onl<strong>in</strong>e dur<strong>in</strong>g measurements of<br />
<strong>N2O</strong> <strong>production</strong>. The purpose was both to exam<strong>in</strong>e NO2-N concentration changes <strong>in</strong> the<br />
<strong>anammox</strong> <strong>process</strong> and to see if it was possible to replace the traditional NO2-N analysis<br />
with Dr Lange kit (LCK 342/341). Two typical measurement occasions where the<br />
biosensor has been used are shown here <strong>in</strong> . All concentrations profiles achieved<br />
through measurements made with the biosensor can be found <strong>in</strong> appendix C, the sensor<br />
was not <strong>in</strong> use dur<strong>in</strong>g measurements of <strong>N2O</strong> <strong>production</strong> 14-15 of September. The reason<br />
for not us<strong>in</strong>g the sensor was that there were problems <strong>in</strong> achiev<strong>in</strong>g a stable sensor signal<br />
dur<strong>in</strong>g calibration and the biochamber had to be exchanged.<br />
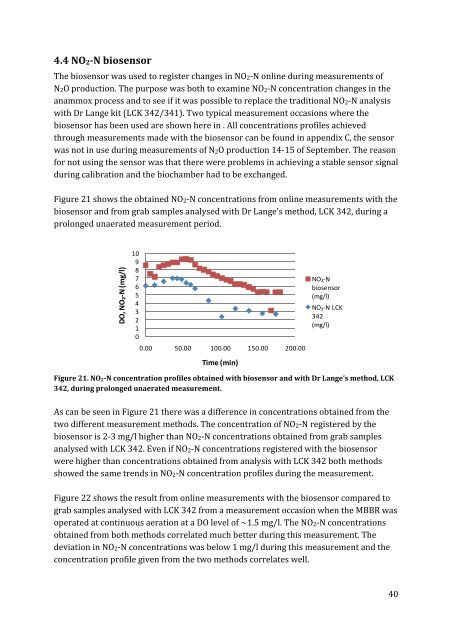
Figure 21 shows the obta<strong>in</strong>ed NO2-N concentrations from onl<strong>in</strong>e measurements with the<br />
biosensor and from grab samples analysed with Dr Lange’s method, LCK 342, dur<strong>in</strong>g a<br />
prolonged unaerated measurement period.<br />
DO, NO₂-N (mg/l)<br />
10<br />
9<br />
8<br />
7<br />
6<br />
5<br />
4<br />
3<br />
2<br />
1<br />
0<br />
0.00 50.00 100.00 150.00 200.00<br />
Time (m<strong>in</strong>)<br />
NO₂-N<br />
biosensor<br />
(mg/l)<br />
NO₂-N LCK<br />
342<br />
(mg/l)<br />
Figure 21. NO 2-N concentration profiles obta<strong>in</strong>ed with biosensor and with Dr Lange’s method, LCK<br />
342, dur<strong>in</strong>g prolonged unaerated measurement.<br />
As can be seen <strong>in</strong> Figure 21 there was a difference <strong>in</strong> concentrations obta<strong>in</strong>ed from the<br />
two different measurement methods. The concentration of NO2-N registered by the<br />
biosensor is 2-3 mg/l higher than NO2-N concentrations obta<strong>in</strong>ed from grab samples<br />
analysed with LCK 342. Even if NO2-N concentrations registered with the biosensor<br />
were higher than concentrations obta<strong>in</strong>ed from analysis with LCK 342 both methods<br />
showed the same trends <strong>in</strong> NO2-N concentration profiles dur<strong>in</strong>g the measurement.<br />
Figure 22 shows the result from onl<strong>in</strong>e measurements with the biosensor compared to<br />
grab samples analysed with LCK 342 from a measurement occasion when the <strong>MBBR</strong> was<br />
operated at cont<strong>in</strong>uous aeration at a DO level of ~1.5 mg/l. The NO2-N concentrations<br />
obta<strong>in</strong>ed from both methods correlated much better dur<strong>in</strong>g this measurement. The<br />
deviation <strong>in</strong> NO2-N concentrations was below 1 mg/l dur<strong>in</strong>g this measurement and the<br />
concentration profile given from the two methods correlates well.<br />
40


