

N2O production in a single stage nitritation/anammox MBBR process
N2O production in a single stage nitritation/anammox MBBR process
N2O production in a single stage nitritation/anammox MBBR process

Create successful ePaper yourself
Turn your PDF publications into a flip-book with our unique Google optimized e-Paper software.
Aeration 1.6 (l/m<strong>in</strong>) with carriers<br />
N₂O (µmo/l)<br />
14<br />
12<br />
10<br />
8<br />
6<br />
4<br />
2<br />
0<br />
0 5 10 15 20 25<br />
Time (m<strong>in</strong>)<br />
<strong>N2O</strong> (µmol/l)<br />
y = -0.6482x + 10.193<br />
y = 12.95e -0.143x<br />
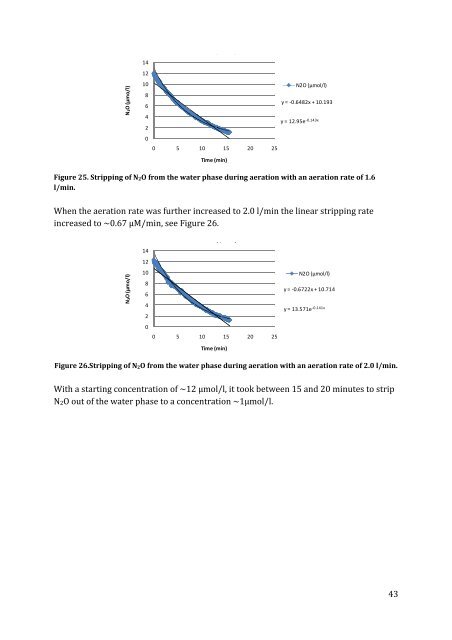
Figure 25. Stripp<strong>in</strong>g of N 2O from the water phase dur<strong>in</strong>g aeration with an aeration rate of 1.6<br />
l/m<strong>in</strong>.<br />
When the aeration rate was further <strong>in</strong>creased to 2.0 l/m<strong>in</strong> the l<strong>in</strong>ear stripp<strong>in</strong>g rate<br />
<strong>in</strong>creased to ~0.67 µM/m<strong>in</strong>, see Figure 26.<br />
14<br />
Aeration 2.0 (l/m<strong>in</strong>) with carriers<br />
N₂O (µmo/l)<br />
12<br />
10<br />
8<br />
6<br />
4<br />
2<br />
0<br />
0 5 10 15 20 25<br />
Time (m<strong>in</strong>)<br />
<strong>N2O</strong> (µmol/l)<br />
y = -0.6722x + 10.714<br />
y = 13.571e -0.141x<br />
Figure 26.Stripp<strong>in</strong>g of N 2O from the water phase dur<strong>in</strong>g aeration with an aeration rate of 2.0 l/m<strong>in</strong>.<br />
With a start<strong>in</strong>g concentration of ~12 µmol/l, it took between 15 and 20 m<strong>in</strong>utes to strip<br />
<strong>N2O</strong> out of the water phase to a concentration ~1µmol/l.<br />
43


