

N2O production in a single stage nitritation/anammox MBBR process
N2O production in a single stage nitritation/anammox MBBR process
N2O production in a single stage nitritation/anammox MBBR process

Create successful ePaper yourself
Turn your PDF publications into a flip-book with our unique Google optimized e-Paper software.
of <strong>N2O</strong> dur<strong>in</strong>g aeration was slightly higher and that the maximum concentration reached<br />
was lower than dur<strong>in</strong>g <strong>in</strong>termittent aeration.<br />
Initial and maximum % <strong>N2O</strong> <strong>production</strong> was calculated to be <strong>in</strong> the range of 2-3.2% and<br />
5.6.-6.2% of removed <strong>in</strong>organic nitrogen respectively, the result is presented <strong>in</strong> Table<br />
11.<br />
Table 11. Average N 2O concentration <strong>in</strong> the water phase dur<strong>in</strong>g aeration. Calculated <strong>in</strong>itial and<br />
maximum N 2O <strong>production</strong> rates, mean O 2 concentrations dur<strong>in</strong>g aeration, mean nitrogen<br />
concentration, reduction and removal rates for studies at cont<strong>in</strong>uous operation mode DO ~1.5<br />
mg/l.<br />
Produced N 2O <strong>in</strong> % of<br />
Average<br />
N 2O<br />
removed <strong>in</strong>organic N-<br />
concentration O 2<br />
mean N-concentration<br />
mg/l<br />
N-red. Removal<br />
Date µmol/l <strong>in</strong>itial max mg/l NH 4-N NO 3-N NO 2-N % gN/m 2 d<br />
091006 4.3 2.8 5.6 1.3 249 25.2 0.3 66 1.3<br />
091007 2.9 2.1 5.6 1.8 246 28.9 0.0 64 1.3<br />
091010 3.3 3.2 6.2 1.8 220 36.3 0.0 72 1.3<br />
4.3.4 Cont<strong>in</strong>uous operation at DO ~1.0 mg/l<br />
Two measurements were performed at a constant aeration with a DO concentration of 1<br />
mg/l. Registered <strong>N2O</strong> accumulation was the lowest so far and the <strong>in</strong>itial <strong>N2O</strong> <strong>production</strong><br />
was below 2% of reduced <strong>in</strong>organic nitrogen. Maximum <strong>production</strong> varied between 2-<br />
4.3%. Table 12 presents the results from cont<strong>in</strong>uous operation at DO concentration of~1<br />
mg/l.<br />
12<br />
10<br />
4.5<br />
3.75<br />
N₂O (µmol/l)<br />
8<br />
6<br />
4<br />
2<br />
3<br />
2.25<br />
1.5<br />
0.75<br />
DO (mg/l)<br />
N₂O<br />
(µmol/l)<br />
DO<br />
(mg/l)<br />
0<br />
0<br />
0 20 40 60 80<br />
Time (m<strong>in</strong>)<br />
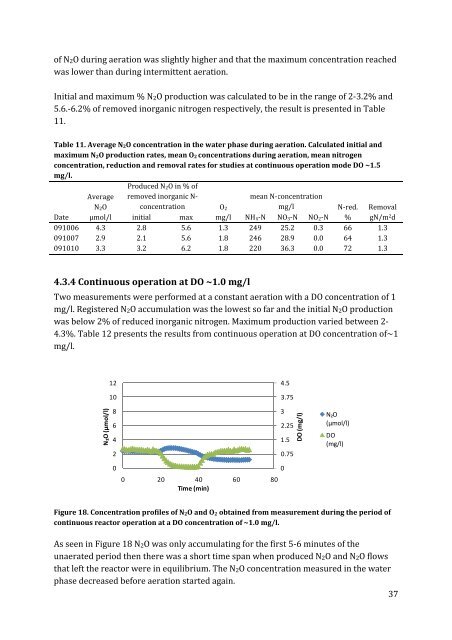
Figure 18. Concentration profiles of N 2O and O 2 obta<strong>in</strong>ed from measurement dur<strong>in</strong>g the period of<br />
cont<strong>in</strong>uous reactor operation at a DO concentration of ~1.0 mg/l.<br />
As seen <strong>in</strong> Figure 18 <strong>N2O</strong> was only accumulat<strong>in</strong>g for the first 5-6 m<strong>in</strong>utes of the<br />
unaerated period then there was a short time span when produced <strong>N2O</strong> and <strong>N2O</strong> flows<br />
that left the reactor were <strong>in</strong> equilibrium. The <strong>N2O</strong> concentration measured <strong>in</strong> the water<br />
phase decreased before aeration started aga<strong>in</strong>.<br />
37


