

N2O production in a single stage nitritation/anammox MBBR process
N2O production in a single stage nitritation/anammox MBBR process
N2O production in a single stage nitritation/anammox MBBR process

You also want an ePaper? Increase the reach of your titles
YUMPU automatically turns print PDFs into web optimized ePapers that Google loves.
N₂O µmol/l<br />
12<br />
10<br />
8<br />
6<br />
4<br />
2<br />
0<br />
0 100 200 300 400 500<br />
N₂O (µmol/l)<br />
y = -0.0132x + 10.59<br />
Time (m<strong>in</strong>)<br />
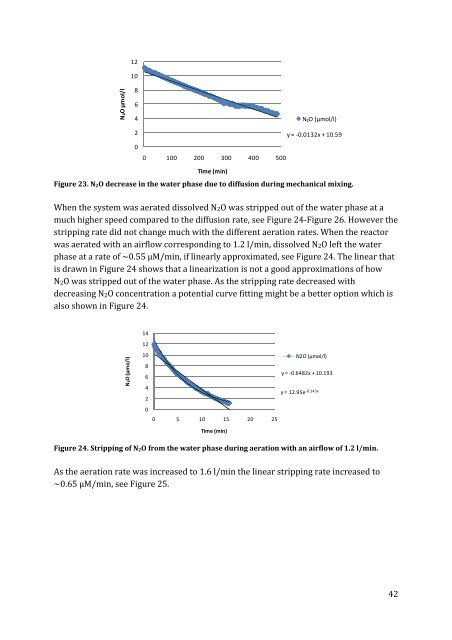
Figure 23. N 2O decrease <strong>in</strong> the water phase due to diffusion dur<strong>in</strong>g mechanical mix<strong>in</strong>g.<br />
When the system was aerated dissolved <strong>N2O</strong> was stripped out of the water phase at a<br />
much higher speed compared to the diffusion rate, see Figure 24-Figure 26. However the<br />
stripp<strong>in</strong>g rate did not change much with the different aeration rates. When the reactor<br />
was aerated with an airflow correspond<strong>in</strong>g to 1.2 l/m<strong>in</strong>, dissolved <strong>N2O</strong> left the water<br />
phase at a rate of ~0.55 µM/m<strong>in</strong>, if l<strong>in</strong>early approximated, see Figure 24. The l<strong>in</strong>ear that<br />
is drawn <strong>in</strong> Figure 24 shows that a l<strong>in</strong>earization is not a good approximations of how<br />
<strong>N2O</strong> was stripped out of the water phase. As the stripp<strong>in</strong>g rate decreased with<br />
decreas<strong>in</strong>g <strong>N2O</strong> concentration a potential curve fitt<strong>in</strong>g might be a better option which is<br />
also shown <strong>in</strong> Figure 24.<br />
14<br />
Aeration 1.6 (l/m<strong>in</strong>) with carriers<br />
N₂O (µmo/l)<br />
12<br />
10<br />
8<br />
6<br />
4<br />
2<br />
0<br />
0 5 10 15 20 25<br />
Time (m<strong>in</strong>)<br />
<strong>N2O</strong> (µmol/l)<br />
y = -0.6482x + 10.193<br />
y = 12.95e -0.143x<br />
Figure 24. Stripp<strong>in</strong>g of N 2O from the water phase dur<strong>in</strong>g aeration with an airflow of 1.2 l/m<strong>in</strong>.<br />
As the aeration rate was <strong>in</strong>creased to 1.6 l/m<strong>in</strong> the l<strong>in</strong>ear stripp<strong>in</strong>g rate <strong>in</strong>creased to<br />
~0.65 µM/m<strong>in</strong>, see Figure 25.<br />
42


