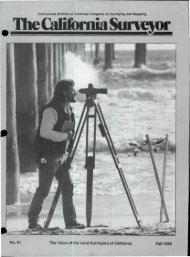
Sacramento Surveyors Visit the NGS Airborne Gravimeter - CLSA
Sacramento Surveyors Visit the NGS Airborne Gravimeter - CLSA
Sacramento Surveyors Visit the NGS Airborne Gravimeter - CLSA

You also want an ePaper? Increase the reach of your titles
YUMPU automatically turns print PDFs into web optimized ePapers that Google loves.
Continued from previous page<br />
base, <strong>the</strong> operations plan was a survey that covered <strong>the</strong><br />
nor<strong>the</strong>rn third of CA and <strong>the</strong> southwestern part of Oregon.<br />
On February 1, 2011, a second pilot was added to <strong>the</strong> project<br />
to enable two flights per day. <strong>NGS</strong> expects to be able<br />
to complete <strong>the</strong> current survey layout and some additional<br />
lines in ano<strong>the</strong>r block south of <strong>the</strong> original survey plan.<br />
Data Collection<br />
Data collection consists of <strong>the</strong> following: The plane flies<br />
at 20,000 ft and between 200-250 knots (kts) ground<br />
speed, operating a relative airborne gravimeter, two<br />
GPS/inertial measurement unit (IMU) packages and one<br />
standalone GPS unit. These three GPS units help determine<br />
<strong>the</strong> pitch, roll, and yaw of <strong>the</strong> aircraft during flight.<br />
Here’s how it works: Within <strong>the</strong> sensor, a “proof mass” on a<br />
pivoting beam is supported against <strong>the</strong> force of gravity by<br />
a “zero-length spring” (one that is pre-stressed so that its<br />
un-extended length is zero). As <strong>the</strong> force of gravity increases,<br />
<strong>the</strong> beam is deflected downward. The meter <strong>the</strong>n exerts<br />
a greater force on <strong>the</strong> spring to keep <strong>the</strong> beam at a null<br />
position. The meter records how much tension is being<br />
exerted on <strong>the</strong> spring and <strong>the</strong> motion of <strong>the</strong> beam. These<br />
measurements are combined to compute a total vertical<br />
acceleration. Gravity is <strong>the</strong> difference between this total<br />
vertical acceleration and <strong>the</strong> vertical acceleration of <strong>the</strong> aircraft<br />
only as determined with kinematic GPS methods.<br />
Corrections are also made for <strong>the</strong> effects of measurement<br />
from a moving platform.<br />
Like o<strong>the</strong>r airborne data collection efforts, <strong>the</strong> geometric<br />
location (latitude, longitude, and ellipsoid height) of <strong>the</strong><br />
plane is determined by relating to data collected at GPS<br />
base stations. Three GNSS<br />
units are operated as static<br />
base stations at <strong>the</strong> airport.<br />
Additionally, <strong>the</strong> record interval<br />
at several of <strong>the</strong> CORS in<br />
nor<strong>the</strong>rn CA and sou<strong>the</strong>rn OR<br />
was increased to one second<br />
for this period so <strong>the</strong>y could be<br />
used as base stations for <strong>the</strong><br />
flights. The continuous GPS<br />
(CGPS ) stations involved were<br />
all <strong>NGS</strong> Continuously<br />
Operating Reference Stations<br />
(CORS): LFLO (Florence) and<br />
LPSB (Eugene) in <strong>the</strong> Oregon<br />
RTN; DOT1 and ZOLE in <strong>the</strong><br />
Washoe County (NV) RTN;<br />
MODB, YBHB, HOPB, and<br />
CMBB from <strong>the</strong> BARD (Bay<br />
Area Regional Deformation) network and ZOA1 which is <strong>the</strong><br />
CORS associated with <strong>the</strong> Oakland airport control tower.<br />
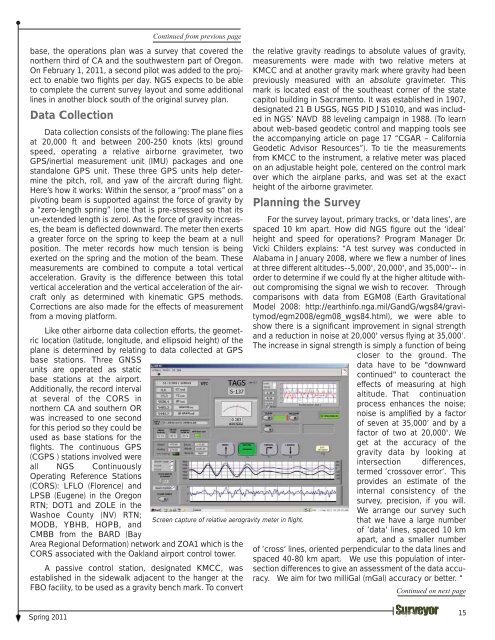
Screen capture of relative aerogravity meter in flight.<br />
A passive control station, designated KMCC, was<br />
established in <strong>the</strong> sidewalk adjacent to <strong>the</strong> hanger at <strong>the</strong><br />
FBO facility, to be used as a gravity bench mark. To convert<br />
<strong>the</strong> relative gravity readings to absolute values of gravity,<br />
measurements were made with two relative meters at<br />
KMCC and at ano<strong>the</strong>r gravity mark where gravity had been<br />
previously measured with an absolute gravimeter. This<br />
mark is located east of <strong>the</strong> sou<strong>the</strong>ast corner of <strong>the</strong> state<br />
capitol building in <strong>Sacramento</strong>. It was established in 1907,<br />
designated 21 B USGS, <strong>NGS</strong> PID JS1010, and was included<br />
in <strong>NGS</strong>’ NAVD 88 leveling campaign in 1988. (To learn<br />
about web-based geodetic control and mapping tools see<br />
<strong>the</strong> accompanying article on page 17 “CGAR – California<br />
Geodetic Advisor Resources”). To tie <strong>the</strong> measurements<br />
from KMCC to <strong>the</strong> instrument, a relative meter was placed<br />
on an adjustable height pole, centered on <strong>the</strong> control mark<br />
over which <strong>the</strong> airplane parks, and was set at <strong>the</strong> exact<br />
height of <strong>the</strong> airborne gravimeter.<br />
Planning <strong>the</strong> Survey<br />
For <strong>the</strong> survey layout, primary tracks, or ‘data lines’, are<br />
spaced 10 km apart. How did <strong>NGS</strong> figure out <strong>the</strong> ‘ideal’<br />
height and speed for operations? Program Manager Dr.<br />
Vicki Childers explains: “A test survey was conducted in<br />
Alabama in January 2008, where we flew a number of lines<br />
at three different altitudes--5,000', 20,000', and 35,000'-- in<br />
order to determine if we could fly at <strong>the</strong> higher altitude without<br />
compromising <strong>the</strong> signal we wish to recover. Through<br />
comparisons with data from EGM08 (Earth Gravitational<br />
Model 2008: http://earthinfo.nga.mil/GandG/wgs84/gravitymod/egm2008/egm08_wgs84.html),<br />
we were able to<br />
show <strong>the</strong>re is a significant improvement in signal strength<br />
and a reduction in noise at 20,000' versus flying at 35,000’.<br />
The increase in signal strength is simply a function of being<br />
closer to <strong>the</strong> ground. The<br />
data have to be "downward<br />
continued" to counteract <strong>the</strong><br />
effects of measuring at high<br />
altitude. That continuation<br />
process enhances <strong>the</strong> noise;<br />
noise is amplified by a factor<br />
of seven at 35,000’ and by a<br />
factor of two at 20,000'. We<br />
get at <strong>the</strong> accuracy of <strong>the</strong><br />
gravity data by looking at<br />
intersection differences,<br />
termed ’crossover error‘. This<br />
provides an estimate of <strong>the</strong><br />
internal consistency of <strong>the</strong><br />
survey, precision, if you will.<br />
We arrange our survey such<br />
that we have a large number<br />
of ’data‘ lines, spaced 10 km<br />
apart, and a smaller number<br />
of ’cross‘ lines, oriented perpendicular to <strong>the</strong> data lines and<br />
spaced 40-80 km apart. We use this population of intersection<br />
differences to give an assessment of <strong>the</strong> data accuracy.<br />
We aim for two milliGal (mGal) accuracy or better. “<br />
Continued on next page<br />
Spring 2011<br />
15