A guide for the preparation and use of buffers in biological systems
A guide for the preparation and use of buffers in biological systems
A guide for the preparation and use of buffers in biological systems

You also want an ePaper? Increase the reach of your titles
YUMPU automatically turns print PDFs into web optimized ePapers that Google loves.
<strong>in</strong>terest. Sometimes <strong>the</strong> term pK b<br />
is <strong>use</strong>d. pK b<br />
(“b” refers to base) is <strong>use</strong>d when <strong>the</strong><br />
system is be<strong>in</strong>g considered as a base <strong>and</strong> <strong>the</strong> hydroxide ion concentration or pOH<br />
is <strong>of</strong> greater <strong>in</strong>terest.<br />
Determ<strong>in</strong>ation <strong>of</strong> pK a<br />
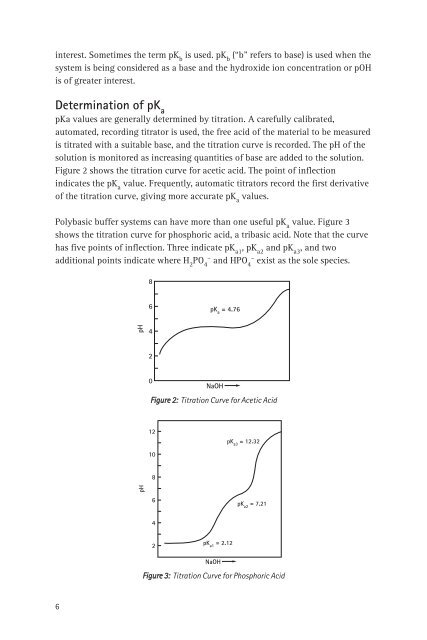
pKa values are generally determ<strong>in</strong>ed by titration. A carefully calibrated,<br />
automated, record<strong>in</strong>g titrator is <strong>use</strong>d, <strong>the</strong> free acid <strong>of</strong> <strong>the</strong> material to be measured<br />
is titrated with a suitable base, <strong>and</strong> <strong>the</strong> titration curve is recorded. The pH <strong>of</strong> <strong>the</strong><br />
solution is monitored as <strong>in</strong>creas<strong>in</strong>g quantities <strong>of</strong> base are added to <strong>the</strong> solution.<br />
Figure 2 shows <strong>the</strong> titration curve <strong>for</strong> acetic acid. The po<strong>in</strong>t <strong>of</strong> <strong>in</strong>flection<br />
<strong>in</strong>dicates <strong>the</strong> pK a<br />
value. Frequently, automatic titrators record <strong>the</strong> first derivative<br />
<strong>of</strong> <strong>the</strong> titration curve, giv<strong>in</strong>g more accurate pK a<br />
values.<br />
Polybasic buffer <strong>systems</strong> can have more than one <strong>use</strong>ful pK a<br />
value. Figure 3<br />
shows <strong>the</strong> titration curve <strong>for</strong> phosphoric acid, a tribasic acid. Note that <strong>the</strong> curve<br />
has five po<strong>in</strong>ts <strong>of</strong> <strong>in</strong>flection. Three <strong>in</strong>dicate pK a1<br />
, pK a2<br />
<strong>and</strong> pK a3<br />
, <strong>and</strong> two<br />
additional po<strong>in</strong>ts <strong>in</strong>dicate where H 2<br />
PO 4 – <strong>and</strong> HPO 4 – exist as <strong>the</strong> sole species.<br />
8<br />
6<br />
pK a = 4.76<br />
pH<br />
4<br />
2<br />
0<br />
NaOH<br />
Figure 2: Titration Curve <strong>for</strong> Acetic Acid<br />
12<br />
pK a3 = 12.32<br />
10<br />
8<br />
pH<br />
6<br />
pK a2 = 7.21<br />
4<br />
2<br />
pK a1 = 2.12<br />
NaOH<br />
Figure 3: Titration Curve <strong>for</strong> Phosphoric Acid<br />
6