

force_download.php?fp=/client_assets/cp/publication/676/A_Child_Rights_Impact_Assessment_of_Budget_Decisions
force_download.php?fp=/client_assets/cp/publication/676/A_Child_Rights_Impact_Assessment_of_Budget_Decisions
force_download.php?fp=/client_assets/cp/publication/676/A_Child_Rights_Impact_Assessment_of_Budget_Decisions

Create successful ePaper yourself
Turn your PDF publications into a flip-book with our unique Google optimized e-Paper software.
2.4.2 <strong>Impact</strong> <strong>of</strong> tax, tax credit and welfare benefit changes on child poverty<br />
Analysis using the Landman Economics tax-benefit model <strong>of</strong> the impact <strong>of</strong> the<br />
overall package <strong>of</strong> tax, tax credit and benefit measures, excluding Universal Credit,<br />
in <strong>Budget</strong>s between 2010 and 2013 (inclusive) on child poverty shows that the<br />
number <strong>of</strong> children in the UK 23 below the <strong>of</strong>ficial poverty line (60 percent median<br />
Before Housing Costs (BHC) equivalised disposable incomes 24 ) is estimated to<br />
increase from approximately 2.3 million children in 2010-11 to around 3.0 million<br />
children by 2015-16. Including Universal Credit leads to a slightly smaller child<br />
poverty figure <strong>of</strong> 2.9 million children – an increase <strong>of</strong> around 600,000 rather than<br />
700,000. Approximately forty percent <strong>of</strong> the additional children moving into poverty<br />
as a result <strong>of</strong> these changes (plus Universal Credit) are in lone parent families, with<br />
the other sixty percent in couple families. Around 400,000 <strong>of</strong> the additional children<br />
moving into poverty are in households in which one or both parents work, whereas<br />
the other 200,000 are in households in which no parent is in employment. In-work<br />
child poverty is thus likely to grow as a result <strong>of</strong> changes to the tax and transfer<br />
system.<br />
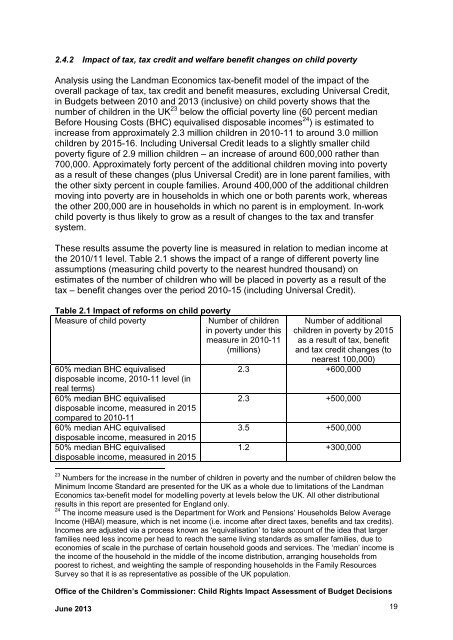
These results assume the poverty line is measured in relation to median income at<br />
the 2010/11 level. Table 2.1 shows the impact <strong>of</strong> a range <strong>of</strong> different poverty line<br />
assumptions (measuring child poverty to the nearest hundred thousand) on<br />
estimates <strong>of</strong> the number <strong>of</strong> children who will be placed in poverty as a result <strong>of</strong> the<br />
tax – benefit changes over the period 2010-15 (including Universal Credit).<br />
Table 2.1 <strong>Impact</strong> <strong>of</strong> reforms on child poverty<br />
Measure <strong>of</strong> child poverty<br />
Number <strong>of</strong> children<br />
in poverty under this<br />
measure in 2010-11<br />
(millions)<br />
60% median BHC equivalised<br />
disposable income, 2010-11 level (in<br />
real terms)<br />
60% median BHC equivalised<br />
disposable income, measured in 2015<br />
compared to 2010-11<br />
60% median AHC equivalised<br />
disposable income, measured in 2015<br />
50% median BHC equivalised<br />
disposable income, measured in 2015<br />
Number <strong>of</strong> additional<br />
children in poverty by 2015<br />
as a result <strong>of</strong> tax, benefit<br />
and tax credit changes (to<br />
nearest 100,000)<br />
2.3 +600,000<br />
2.3 +500,000<br />
3.5 +500,000<br />
1.2 +300,000<br />
23 Numbers for the increase in the number <strong>of</strong> children in poverty and the number <strong>of</strong> children below the<br />
Minimum Income Standard are presented for the UK as a whole due to limitations <strong>of</strong> the Landman<br />
Economics tax-benefit model for modelling poverty at levels below the UK. All other distributional<br />
results in this report are presented for England only.<br />
24 The income measure used is the Department for Work and Pensions’ Households Below Average<br />
Income (HBAI) measure, which is net income (i.e. income after direct taxes, benefits and tax credits).<br />
Incomes are adjusted via a process known as ‘equivalisation’ to take account <strong>of</strong> the idea that larger<br />
families need less income per head to reach the same living standards as smaller families, due to<br />
economies <strong>of</strong> scale in the purchase <strong>of</strong> certain household goods and services. The ‘median’ income is<br />
the income <strong>of</strong> the household in the middle <strong>of</strong> the income distribution, arranging households from<br />
poorest to richest, and weighting the sample <strong>of</strong> responding households in the Family Resources<br />
Survey so that it is as representative as possible <strong>of</strong> the UK population.<br />
Office <strong>of</strong> the <strong>Child</strong>ren’s Commissioner: <strong>Child</strong> <strong>Rights</strong> <strong>Impact</strong> <strong>Assessment</strong> <strong>of</strong> <strong>Budget</strong> <strong>Decisions</strong><br />
June 2013 19
