

force_download.php?fp=/client_assets/cp/publication/676/A_Child_Rights_Impact_Assessment_of_Budget_Decisions
force_download.php?fp=/client_assets/cp/publication/676/A_Child_Rights_Impact_Assessment_of_Budget_Decisions
force_download.php?fp=/client_assets/cp/publication/676/A_Child_Rights_Impact_Assessment_of_Budget_Decisions

You also want an ePaper? Increase the reach of your titles
YUMPU automatically turns print PDFs into web optimized ePapers that Google loves.
3.6 The distributional impact <strong>of</strong> public spending decisions<br />
3.6.1 The impact <strong>of</strong> cuts, by family type<br />
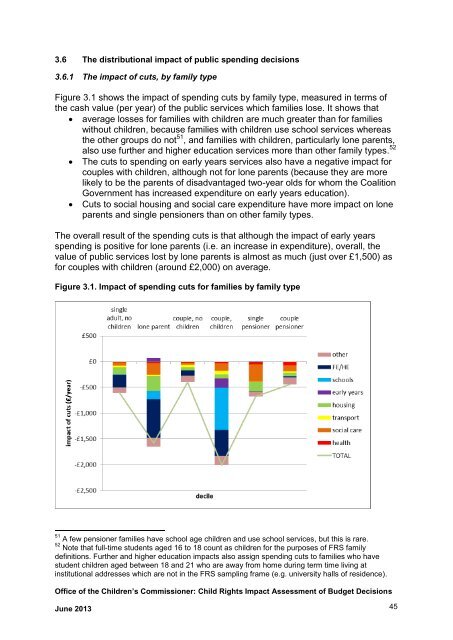
Figure 3.1 shows the impact <strong>of</strong> spending cuts by family type, measured in terms <strong>of</strong><br />
the cash value (per year) <strong>of</strong> the public services which families lose. It shows that<br />
average losses for families with children are much greater than for families<br />
without children, because families with children use school services whereas<br />
the other groups do not 51 , and families with children, particularly lone parents,<br />
also use further and higher education services more than other family types. 52<br />
The cuts to spending on early years services also have a negative impact for<br />
couples with children, although not for lone parents (because they are more<br />
likely to be the parents <strong>of</strong> disadvantaged two-year olds for whom the Coalition<br />
Government has increased expenditure on early years education).<br />
Cuts to social housing and social care expenditure have more impact on lone<br />
parents and single pensioners than on other family types.<br />
The overall result <strong>of</strong> the spending cuts is that although the impact <strong>of</strong> early years<br />
spending is positive for lone parents (i.e. an increase in expenditure), overall, the<br />
value <strong>of</strong> public services lost by lone parents is almost as much (just over £1,500) as<br />
for couples with children (around £2,000) on average.<br />
Figure 3.1. <strong>Impact</strong> <strong>of</strong> spending cuts for families by family type<br />
51 A few pensioner families have school age children and use school services, but this is rare.<br />
52 Note that full-time students aged 16 to 18 count as children for the purposes <strong>of</strong> FRS family<br />
definitions. Further and higher education impacts also assign spending cuts to families who have<br />
student children aged between 18 and 21 who are away from home during term time living at<br />
institutional addresses which are not in the FRS sampling frame (e.g. university halls <strong>of</strong> residence).<br />
Office <strong>of</strong> the <strong>Child</strong>ren’s Commissioner: <strong>Child</strong> <strong>Rights</strong> <strong>Impact</strong> <strong>Assessment</strong> <strong>of</strong> <strong>Budget</strong> <strong>Decisions</strong><br />
June 2013 45
