

force_download.php?fp=/client_assets/cp/publication/676/A_Child_Rights_Impact_Assessment_of_Budget_Decisions
force_download.php?fp=/client_assets/cp/publication/676/A_Child_Rights_Impact_Assessment_of_Budget_Decisions
force_download.php?fp=/client_assets/cp/publication/676/A_Child_Rights_Impact_Assessment_of_Budget_Decisions

Create successful ePaper yourself
Turn your PDF publications into a flip-book with our unique Google optimized e-Paper software.
2.5.6 The impact <strong>of</strong> tax, tax credit and welfare benefit measures on families where<br />
there is a disabled child or disabled adult<br />
This section looks at whether children who are disabled or who have a disabled<br />
sibling are affected differently by the reforms than children living in other families.<br />
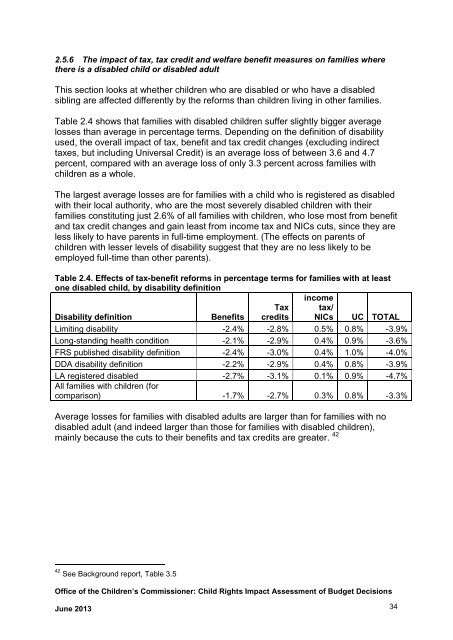
Table 2.4 shows that families with disabled children suffer slightly bigger average<br />
losses than average in percentage terms. Depending on the definition <strong>of</strong> disability<br />
used, the overall impact <strong>of</strong> tax, benefit and tax credit changes (excluding indirect<br />
taxes, but including Universal Credit) is an average loss <strong>of</strong> between 3.6 and 4.7<br />
percent, compared with an average loss <strong>of</strong> only 3.3 percent across families with<br />
children as a whole.<br />
The largest average losses are for families with a child who is registered as disabled<br />
with their local authority, who are the most severely disabled children with their<br />
families constituting just 2.6% <strong>of</strong> all families with children, who lose most from benefit<br />
and tax credit changes and gain least from income tax and NICs cuts, since they are<br />
less likely to have parents in full-time employment. (The effects on parents <strong>of</strong><br />
children with lesser levels <strong>of</strong> disability suggest that they are no less likely to be<br />
employed full-time than other parents).<br />
Table 2.4. Effects <strong>of</strong> tax-benefit reforms in percentage terms for families with at least<br />
one disabled child, by disability definition<br />
income<br />
Disability definition<br />
Benefits<br />
Tax<br />
credits<br />
tax/<br />
NICs UC TOTAL<br />
Limiting disability -2.4% -2.8% 0.5% 0.8% -3.9%<br />
Long-standing health condition -2.1% -2.9% 0.4% 0.9% -3.6%<br />
FRS published disability definition -2.4% -3.0% 0.4% 1.0% -4.0%<br />
DDA disability definition -2.2% -2.9% 0.4% 0.8% -3.9%<br />
LA registered disabled -2.7% -3.1% 0.1% 0.9% -4.7%<br />
All families with children (for<br />
comparison) -1.7% -2.7% 0.3% 0.8% -3.3%<br />
Average losses for families with disabled adults are larger than for families with no<br />
disabled adult (and indeed larger than those for families with disabled children),<br />
mainly because the cuts to their benefits and tax credits are greater. 42<br />
42 See Background report, Table 3.5<br />
Office <strong>of</strong> the <strong>Child</strong>ren’s Commissioner: <strong>Child</strong> <strong>Rights</strong> <strong>Impact</strong> <strong>Assessment</strong> <strong>of</strong> <strong>Budget</strong> <strong>Decisions</strong><br />
June 2013 34
