

force_download.php?fp=/client_assets/cp/publication/676/A_Child_Rights_Impact_Assessment_of_Budget_Decisions
force_download.php?fp=/client_assets/cp/publication/676/A_Child_Rights_Impact_Assessment_of_Budget_Decisions
force_download.php?fp=/client_assets/cp/publication/676/A_Child_Rights_Impact_Assessment_of_Budget_Decisions

You also want an ePaper? Increase the reach of your titles
YUMPU automatically turns print PDFs into web optimized ePapers that Google loves.
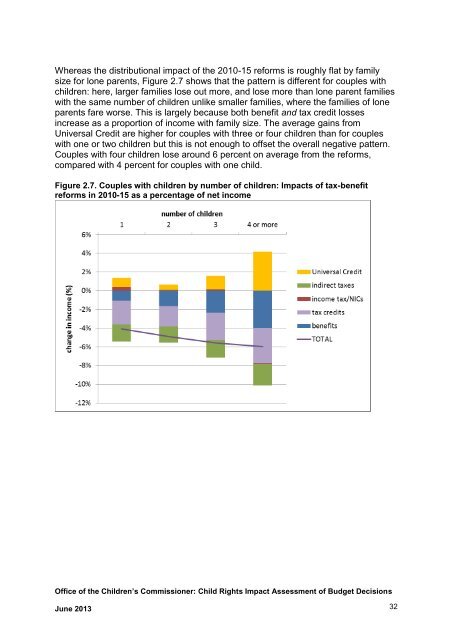
Whereas the distributional impact <strong>of</strong> the 2010-15 reforms is roughly flat by family<br />
size for lone parents, Figure 2.7 shows that the pattern is different for couples with<br />
children: here, larger families lose out more, and lose more than lone parent families<br />
with the same number <strong>of</strong> children unlike smaller families, where the families <strong>of</strong> lone<br />
parents fare worse. This is largely because both benefit and tax credit losses<br />
increase as a proportion <strong>of</strong> income with family size. The average gains from<br />
Universal Credit are higher for couples with three or four children than for couples<br />
with one or two children but this is not enough to <strong>of</strong>fset the overall negative pattern.<br />
Couples with four children lose around 6 percent on average from the reforms,<br />
compared with 4 percent for couples with one child.<br />
Figure 2.7. Couples with children by number <strong>of</strong> children: <strong>Impact</strong>s <strong>of</strong> tax-benefit<br />
reforms in 2010-15 as a percentage <strong>of</strong> net income<br />
Office <strong>of</strong> the <strong>Child</strong>ren’s Commissioner: <strong>Child</strong> <strong>Rights</strong> <strong>Impact</strong> <strong>Assessment</strong> <strong>of</strong> <strong>Budget</strong> <strong>Decisions</strong><br />
June 2013 32
