

force_download.php?fp=/client_assets/cp/publication/676/A_Child_Rights_Impact_Assessment_of_Budget_Decisions
force_download.php?fp=/client_assets/cp/publication/676/A_Child_Rights_Impact_Assessment_of_Budget_Decisions
force_download.php?fp=/client_assets/cp/publication/676/A_Child_Rights_Impact_Assessment_of_Budget_Decisions

Create successful ePaper yourself
Turn your PDF publications into a flip-book with our unique Google optimized e-Paper software.
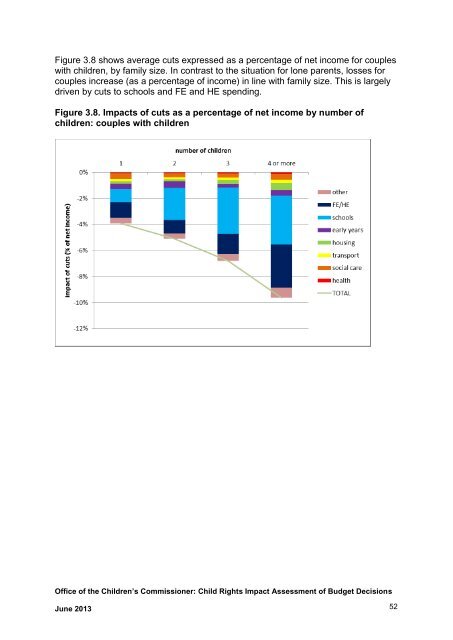
Figure 3.8 shows average cuts expressed as a percentage <strong>of</strong> net income for couples<br />
with children, by family size. In contrast to the situation for lone parents, losses for<br />
couples increase (as a percentage <strong>of</strong> income) in line with family size. This is largely<br />
driven by cuts to schools and FE and HE spending.<br />
Figure 3.8. <strong>Impact</strong>s <strong>of</strong> cuts as a percentage <strong>of</strong> net income by number <strong>of</strong><br />
children: couples with children<br />
Office <strong>of</strong> the <strong>Child</strong>ren’s Commissioner: <strong>Child</strong> <strong>Rights</strong> <strong>Impact</strong> <strong>Assessment</strong> <strong>of</strong> <strong>Budget</strong> <strong>Decisions</strong><br />
June 2013 52
