

force_download.php?fp=/client_assets/cp/publication/676/A_Child_Rights_Impact_Assessment_of_Budget_Decisions
force_download.php?fp=/client_assets/cp/publication/676/A_Child_Rights_Impact_Assessment_of_Budget_Decisions
force_download.php?fp=/client_assets/cp/publication/676/A_Child_Rights_Impact_Assessment_of_Budget_Decisions

Create successful ePaper yourself
Turn your PDF publications into a flip-book with our unique Google optimized e-Paper software.
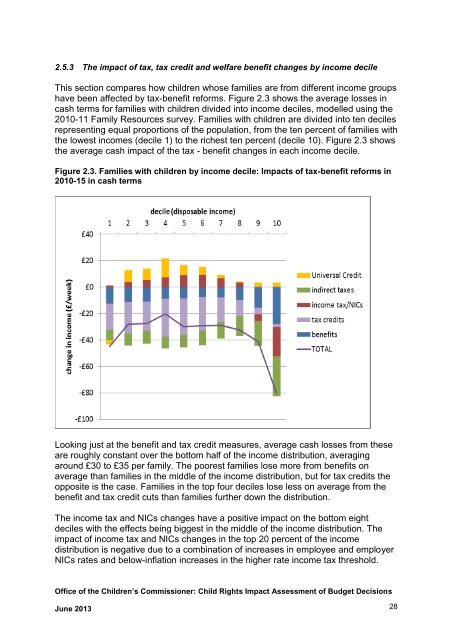
2.5.3 The impact <strong>of</strong> tax, tax credit and welfare benefit changes by income decile<br />
This section compares how children whose families are from different income groups<br />
have been affected by tax-benefit reforms. Figure 2.3 shows the average losses in<br />
cash terms for families with children divided into income deciles, modelled using the<br />
2010-11 Family Resources survey. Families with children are divided into ten deciles<br />
representing equal proportions <strong>of</strong> the population, from the ten percent <strong>of</strong> families with<br />
the lowest incomes (decile 1) to the richest ten percent (decile 10). Figure 2.3 shows<br />
the average cash impact <strong>of</strong> the tax - benefit changes in each income decile.<br />
Figure 2.3. Families with children by income decile: <strong>Impact</strong>s <strong>of</strong> tax-benefit reforms in<br />
2010-15 in cash terms<br />
Looking just at the benefit and tax credit measures, average cash losses from these<br />
are roughly constant over the bottom half <strong>of</strong> the income distribution, averaging<br />
around £30 to £35 per family. The poorest families lose more from benefits on<br />
average than families in the middle <strong>of</strong> the income distribution, but for tax credits the<br />
opposite is the case. Families in the top four deciles lose less on average from the<br />
benefit and tax credit cuts than families further down the distribution.<br />
The income tax and NICs changes have a positive impact on the bottom eight<br />
deciles with the effects being biggest in the middle <strong>of</strong> the income distribution. The<br />
impact <strong>of</strong> income tax and NICs changes in the top 20 percent <strong>of</strong> the income<br />
distribution is negative due to a combination <strong>of</strong> increases in employee and employer<br />
NICs rates and below-inflation increases in the higher rate income tax threshold.<br />
Office <strong>of</strong> the <strong>Child</strong>ren’s Commissioner: <strong>Child</strong> <strong>Rights</strong> <strong>Impact</strong> <strong>Assessment</strong> <strong>of</strong> <strong>Budget</strong> <strong>Decisions</strong><br />
June 2013 28
