

force_download.php?fp=/client_assets/cp/publication/676/A_Child_Rights_Impact_Assessment_of_Budget_Decisions
force_download.php?fp=/client_assets/cp/publication/676/A_Child_Rights_Impact_Assessment_of_Budget_Decisions
force_download.php?fp=/client_assets/cp/publication/676/A_Child_Rights_Impact_Assessment_of_Budget_Decisions

Create successful ePaper yourself
Turn your PDF publications into a flip-book with our unique Google optimized e-Paper software.
2.4.4 The impact <strong>of</strong> tax, tax credit and welfare benefit changes on children who are<br />
affected by material deprivation<br />
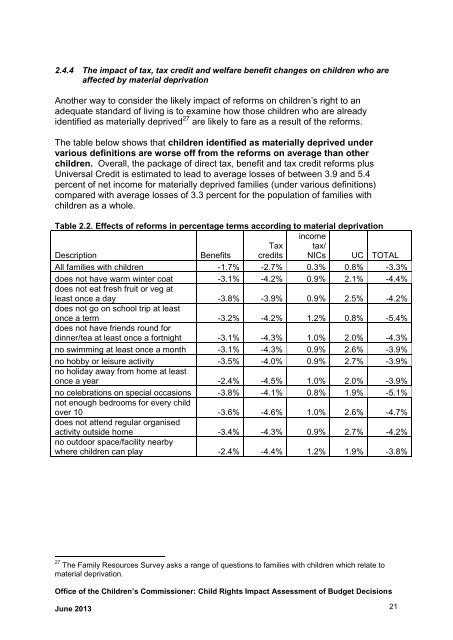
Another way to consider the likely impact <strong>of</strong> reforms on children’s right to an<br />
adequate standard <strong>of</strong> living is to examine how those children who are already<br />
identified as materially deprived 27 are likely to fare as a result <strong>of</strong> the reforms.<br />
The table below shows that children identified as materially deprived under<br />
various definitions are worse <strong>of</strong>f from the reforms on average than other<br />
children. Overall, the package <strong>of</strong> direct tax, benefit and tax credit reforms plus<br />
Universal Credit is estimated to lead to average losses <strong>of</strong> between 3.9 and 5.4<br />
percent <strong>of</strong> net income for materially deprived families (under various definitions)<br />
compared with average losses <strong>of</strong> 3.3 percent for the population <strong>of</strong> families with<br />
children as a whole.<br />
Table 2.2. Effects <strong>of</strong> reforms in percentage terms according to material deprivation<br />
income<br />
Description<br />
Benefits<br />
Tax<br />
credits<br />
tax/<br />
NICs UC TOTAL<br />
All families with children -1.7% -2.7% 0.3% 0.8% -3.3%<br />
does not have warm winter coat -3.1% -4.2% 0.9% 2.1% -4.4%<br />
does not eat fresh fruit or veg at<br />
least once a day -3.8% -3.9% 0.9% 2.5% -4.2%<br />
does not go on school trip at least<br />
once a term -3.2% -4.2% 1.2% 0.8% -5.4%<br />
does not have friends round for<br />
dinner/tea at least once a fortnight -3.1% -4.3% 1.0% 2.0% -4.3%<br />
no swimming at least once a month -3.1% -4.3% 0.9% 2.6% -3.9%<br />
no hobby or leisure activity -3.5% -4.0% 0.9% 2.7% -3.9%<br />
no holiday away from home at least<br />
once a year -2.4% -4.5% 1.0% 2.0% -3.9%<br />
no celebrations on special occasions -3.8% -4.1% 0.8% 1.9% -5.1%<br />
not enough bedrooms for every child<br />
over 10 -3.6% -4.6% 1.0% 2.6% -4.7%<br />
does not attend regular organised<br />
activity outside home -3.4% -4.3% 0.9% 2.7% -4.2%<br />
no outdoor space/facility nearby<br />
where children can play -2.4% -4.4% 1.2% 1.9% -3.8%<br />
27 The Family Resources Survey asks a range <strong>of</strong> questions to families with children which relate to<br />
material deprivation.<br />
Office <strong>of</strong> the <strong>Child</strong>ren’s Commissioner: <strong>Child</strong> <strong>Rights</strong> <strong>Impact</strong> <strong>Assessment</strong> <strong>of</strong> <strong>Budget</strong> <strong>Decisions</strong><br />
June 2013 21
