

force_download.php?fp=/client_assets/cp/publication/676/A_Child_Rights_Impact_Assessment_of_Budget_Decisions
force_download.php?fp=/client_assets/cp/publication/676/A_Child_Rights_Impact_Assessment_of_Budget_Decisions
force_download.php?fp=/client_assets/cp/publication/676/A_Child_Rights_Impact_Assessment_of_Budget_Decisions

Create successful ePaper yourself
Turn your PDF publications into a flip-book with our unique Google optimized e-Paper software.
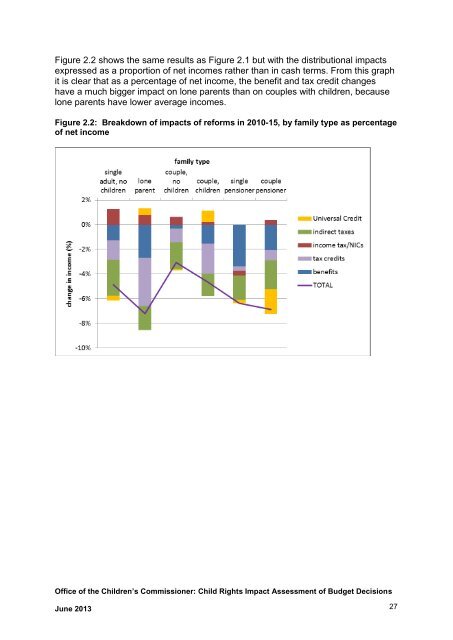
Figure 2.2 shows the same results as Figure 2.1 but with the distributional impacts<br />
expressed as a proportion <strong>of</strong> net incomes rather than in cash terms. From this graph<br />
it is clear that as a percentage <strong>of</strong> net income, the benefit and tax credit changes<br />
have a much bigger impact on lone parents than on couples with children, because<br />
lone parents have lower average incomes.<br />
Figure 2.2: Breakdown <strong>of</strong> impacts <strong>of</strong> reforms in 2010-15, by family type as percentage<br />
<strong>of</strong> net income<br />
Office <strong>of</strong> the <strong>Child</strong>ren’s Commissioner: <strong>Child</strong> <strong>Rights</strong> <strong>Impact</strong> <strong>Assessment</strong> <strong>of</strong> <strong>Budget</strong> <strong>Decisions</strong><br />
June 2013 27
