Trade Show Executive
Trade Show Executive
Trade Show Executive

Create successful ePaper yourself
Turn your PDF publications into a flip-book with our unique Google optimized e-Paper software.
TSE DASHBOARD<br />
SPONSORED BY<br />
Continued from page 23<br />
Broken Record:<br />
CES Outdoes Itself Again<br />
The new year began as it usually does,<br />
with huge crowds and an exhibit floor that<br />
seems to stretch to the horizon at the International<br />
Consumer Electronics <strong>Show</strong> (CES).<br />
It was another record year for CES,<br />
which made plenty of headlines in the<br />
mainstream and trade media and also set<br />
new marks for exhibit space and number<br />
of exhibiting companies. Exhibit space<br />
stepped closer to the 2 million nsf mark<br />
with a 3.4% increase to 1,924,892 nsf.<br />
Exhibitors increased 2.4% to 3,316, but<br />
attendance dropped (2.7)% to 152,000.<br />
The world’s hearty appetite for new<br />
gadgets was one of the bright spots in the<br />
global economy of recent years, and CES<br />
has been an important focal point for the<br />
introduction of the devices destined to<br />
become standard equipment in schools,<br />
homes and offices worldwide. “Some<br />
20,000 new products were launched at the<br />
2013 International CES,” said Gary Shapiro,<br />
CEO of the Consumer Electronics Association.<br />
“Every major technology company<br />
spanning the globe participated in this<br />
year’s CES to showcase their innovations.”<br />
Growth Leaders<br />
• AG CONNECT Expo & Summit was<br />
not included in the adjusted Dashboard<br />
totals because it is a biennial event, but<br />
it delivered record numbers. Attendance<br />
increased 88.5% and exhibit space grew<br />
45.2% to 222,755 nsf. The show, held<br />
this year in the farming hub of Kansas<br />
City, enjoyed a high presence of big-time<br />
agribusiness growers, which appealed to<br />
exhibitors. “These are industry professionals<br />
who specifically wanted to take<br />
advantage of all that AG CONNECT had<br />
to offer,” said show manager Sara Mooney.<br />
• International Production & Processing<br />
Expo was also left off of the adjusted<br />
Dashboard totals because it was the first<br />
time it consisted of trade shows from<br />
three major food groups: The American<br />
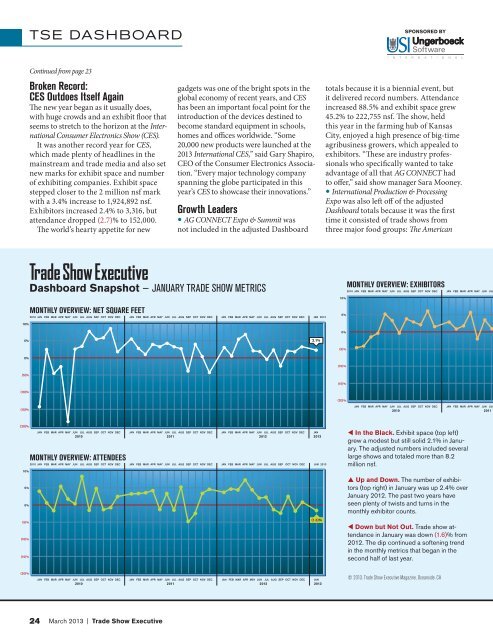
<strong>Trade</strong> <strong>Show</strong> <strong>Executive</strong><br />
Dashboard Snapshot – JANUARY TRADE SHOW METRICS<br />
MONTHLY OVERVIEW: NET SQUARE FEET<br />
2010 JAN FEB MAR APR MAY JUN JUL AUG SEP OCT NOV DEC JAN FEB MAR APR MAY JUN JUL AUG SEP OCT NOV DEC JAN FEB MAR APR MAY JUN JUL AUG SEP OCT NOV DEC JAN 2012<br />
10%<br />
5%<br />
MONTHLY OVERVIEW: EXHIBITORS<br />
2010 JAN FEB MAR APR MAY JUN JUL AUG SEP OCT NOV DEC JAN FEB MAR APR MAY JUN JUL<br />
10%<br />
0%<br />
5%<br />
2.1%<br />
(5)%<br />
0%<br />
(10)%<br />
(5)%<br />
(15)%<br />
(10)%<br />
(20)%<br />
(15)%<br />
JAN FEB MAR APR MAY JUN JUL AUG SEP OCT NOV DEC JAN FEB MAR APR MAY JUN JUL<br />
2010 2011<br />
(20)%<br />
10%<br />
5%<br />
0%<br />
(5)%<br />
(10)%<br />
(15)%<br />
JAN FEB MAR APR MAY JUN JUL AUG SEP OCT NOV DEC JAN FEB MAR APR MAY JUN JUL AUG SEP OCT NOV DEC JAN FEB MAR APR MAY JUN JUL AUG SEP OCT NOV DEC<br />
2010 2011 2012<br />
MONTHLY OVERVIEW: ATTENDEES<br />
2010 JAN FEB MAR APR MAY JUN JUL AUG SEP OCT NOV DEC JAN FEB MAR APR MAY JUN JUL AUG SEP OCT NOV DEC JAN FEB MAR APR MAY JUN JUL AUG SEP<br />
OCT NOV<br />
DEC<br />
JAN<br />
2013<br />
JAN 2013<br />
(1.6)%<br />
t In the Black. Exhibit space (top left)<br />
grew a modest but still solid 2.1% in January.<br />
The adjusted numbers included several<br />
large shows and totaled more than 8.2<br />
million nsf.<br />
p Up and Down. The number of exhibitors<br />
(top right) in January was up 2.4% over<br />
January 2012. The past two years have<br />
seen plenty of twists and turns in the<br />
monthly exhibitor counts.<br />
t Down but Not Out. <strong>Trade</strong> show attendance<br />
in January was down (1.6)% from<br />
2012. The dip continued a softening trend<br />
in the monthly metrics that began in the<br />
second half of last year.<br />
(20)%<br />
JAN FEB MAR APR MAY JUN JUL AUG SEP OCT NOV DEC JAN FEB MAR APR MAY JUN JUL AUG SEP OCT NOV DEC<br />
2010 2011<br />
JAN FEB MAR APR MAY JUN JUL AUG SEP OCT NOV DEC JAN<br />
2012 2013<br />
© 2013, <strong>Trade</strong> <strong>Show</strong> <strong>Executive</strong> Magazine, Oceanside, CA<br />
24 March 2013 | <strong>Trade</strong> <strong>Show</strong> <strong>Executive</strong>