PDF | 2 MB - Australian Building Codes Board
PDF | 2 MB - Australian Building Codes Board
PDF | 2 MB - Australian Building Codes Board

Create successful ePaper yourself
Turn your PDF publications into a flip-book with our unique Google optimized e-Paper software.
PROPOSAL TO REVISE ENERGY EFFICIENCY REQUIREMENTS OF THE BUILDING CODE OF AUSTRALIA FOR COMMERCIAL BUILDINGS 65<br />
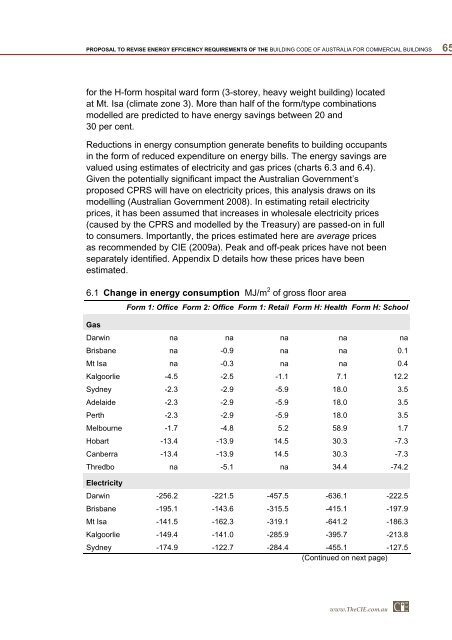
for the H-form hospital ward form (3-storey, heavy weight building) located<br />
at Mt. Isa (climate zone 3). More than half of the form/type combinations<br />
modelled are predicted to have energy savings between 20 and<br />
30 per cent.<br />
Reductions in energy consumption generate benefits to building occupants<br />
in the form of reduced expenditure on energy bills. The energy savings are<br />
valued using estimates of electricity and gas prices (charts 6.3 and 6.4).<br />
Given the potentially significant impact the <strong>Australian</strong> Government’s<br />
proposed CPRS will have on electricity prices, this analysis draws on its<br />
modelling (<strong>Australian</strong> Government 2008). In estimating retail electricity<br />
prices, it has been assumed that increases in wholesale electricity prices<br />
(caused by the CPRS and modelled by the Treasury) are passed-on in full<br />
to consumers. Importantly, the prices estimated here are average prices<br />
as recommended by CIE (2009a). Peak and off-peak prices have not been<br />
separately identified. Appendix D details how these prices have been<br />
estimated.<br />
6.1 Change in energy consumption MJ/m 2 of gross floor area<br />
Gas<br />
Form 1: Office Form 2: Office Form 1: Retail Form H: Health Form H: School<br />
Darwin na na na na na<br />
Brisbane na -0.9 na na 0.1<br />
Mt Isa na -0.3 na na 0.4<br />
Kalgoorlie -4.5 -2.5 -1.1 7.1 12.2<br />
Sydney -2.3 -2.9 -5.9 18.0 3.5<br />
Adelaide -2.3 -2.9 -5.9 18.0 3.5<br />
Perth -2.3 -2.9 -5.9 18.0 3.5<br />
Melbourne -1.7 -4.8 5.2 58.9 1.7<br />
Hobart -13.4 -13.9 14.5 30.3 -7.3<br />
Canberra -13.4 -13.9 14.5 30.3 -7.3<br />
Thredbo na -5.1 na 34.4 -74.2<br />
Electricity<br />
Darwin -256.2 -221.5 -457.5 -636.1 -222.5<br />
Brisbane -195.1 -143.6 -315.5 -415.1 -197.9<br />
Mt Isa -141.5 -162.3 -319.1 -641.2 -186.3<br />
Kalgoorlie -149.4 -141.0 -285.9 -395.7 -213.8<br />
Sydney -174.9 -122.7 -284.4 -455.1 -127.5<br />
(Continued on next page)<br />
www.TheCIE.com.au