Sustainable Transport and the Environment Guide - Unite the Union
Sustainable Transport and the Environment Guide - Unite the Union
Sustainable Transport and the Environment Guide - Unite the Union

Create successful ePaper yourself
Turn your PDF publications into a flip-book with our unique Google optimized e-Paper software.
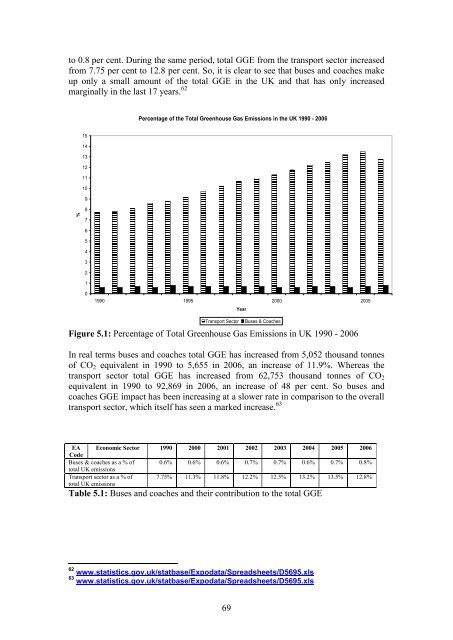
to 0.8 per cent. During <strong>the</strong> same period, total GGE from <strong>the</strong> transport sector increased<br />
from 7.75 per cent to 12.8 per cent. So, it is clear to see that buses <strong>and</strong> coaches make<br />
up only a small amount of <strong>the</strong> total GGE in <strong>the</strong> UK <strong>and</strong> that has only increased<br />
marginally in <strong>the</strong> last 17 years. 62<br />
Percentage of <strong>the</strong> Total Greenhouse Gas Emissions in <strong>the</strong> UK 1990 - 2006<br />
15<br />
14<br />
13<br />
12<br />
11<br />
10<br />
9<br />
%<br />
8<br />
7<br />
6<br />
5<br />
4<br />
3<br />
2<br />
1<br />
0<br />
1990 1995 2000 2005<br />
Year<br />
<strong>Transport</strong> Sector<br />
Buses & Coaches<br />
Figure 5.1: Percentage of Total Greenhouse Gas Emissions in UK 1990 - 2006<br />
In real terms buses <strong>and</strong> coaches total GGE has increased from 5,052 thous<strong>and</strong> tonnes<br />
of CO 2 equivalent in 1990 to 5,655 in 2006, an increase of 11.9%. Whereas <strong>the</strong><br />
transport sector total GGE has increased from 62,753 thous<strong>and</strong> tonnes of CO 2<br />
equivalent in 1990 to 92,869 in 2006, an increase of 48 per cent. So buses <strong>and</strong><br />
coaches GGE impact has been increasing at a slower rate in comparison to <strong>the</strong> overall<br />
transport sector, which itself has seen a marked increase. 63<br />
EA Economic Sector 1990 2000 2001 2002 2003 2004 2005 2006<br />
Code<br />
Buses & coaches as a % of 0.6% 0.6% 0.6% 0.7% 0.7% 0.6% 0.7% 0.8%<br />
total UK emissions<br />
<strong>Transport</strong> sector as a % of<br />
total UK emissions<br />
7.75% 11.3% 11.8% 12.2% 12.5% 13.2% 13.5% 12.8%<br />
Table 5.1: Buses <strong>and</strong> coaches <strong>and</strong> <strong>the</strong>ir contribution to <strong>the</strong> total GGE<br />
62 www.statistics.gov.uk/statbase/Expodata/Spreadsheets/D5695.xls<br />
63 www.statistics.gov.uk/statbase/Expodata/Spreadsheets/D5695.xls<br />
69