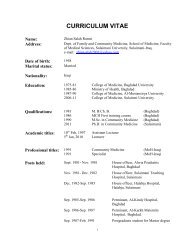
Matlab Chapter6.pdf
Matlab Chapter6.pdf
Matlab Chapter6.pdf

You also want an ePaper? Increase the reach of your titles
YUMPU automatically turns print PDFs into web optimized ePapers that Google loves.
The following statements draw arrows indicating the direction of ∇V at points in the x − y<br />
plane:<br />
≫ [x y] = meshgrid(−2 : .2 : 2, −2 : .2 : 2);<br />
≫ V = x. ∧ 2 + y;<br />
≫ dx = 2 ∗ x;<br />
≫ dy = dx; % dy same size as dx<br />
≫ dy(:, :) = 1; % now dy is same size as dx but all 1’s<br />
≫ contour(x, y, V )<br />
The ‘contour’ lines indicate families of level surfaces; the gradient at any point is perpendicular<br />
to the level surface which passes through that point. The vectors x and y are needed in the call<br />
to contour to specify the axes for the contour plot.<br />
Example 2.5 (Rotation of 3-D graphs) The view function enables you to specify the angle<br />
from which you view a 3-D graph. To see it in operation, run the following program:<br />
2.2.2 Polar plots<br />
≫ a = zeros(30, 30);<br />
≫ a(:, 15) = 0.2 ∗ ones(30, 1);<br />
≫ a(7, :) = 0.1 ∗ ones(1, 30);<br />
≫ a(15, 15) = 1;<br />
≫ mesh(a)<br />
≫ for az = −37.5 : 15 : −37.5 + 360<br />
≫ mesh(a), view(az, el)<br />
≫ pause(0.5)<br />
≫ end<br />
The point (x, y) in cartesian coordinates is represented by the point (θ, r) in polar coordinates,<br />
where<br />
x = r cos(θ),<br />
y = r sin(θ),<br />
and θ varies between 0 and 2θ radians (360 ◦ ).<br />
The command polar(θ, r) generates a polar plot of the points with angles in theta and<br />
magnitudes in r.<br />
As an example, the statements<br />
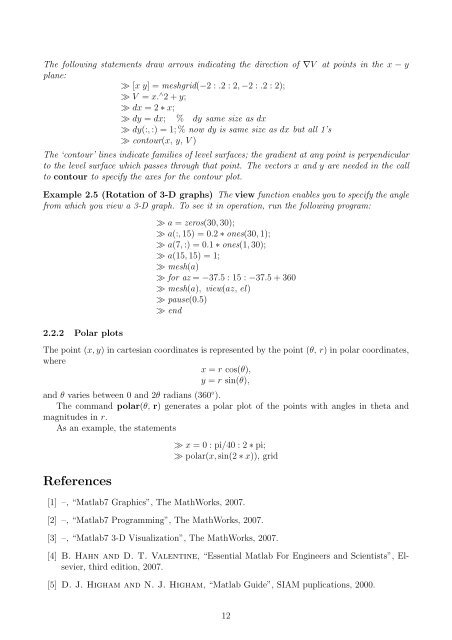
References<br />
≫ x = 0 : pi/40 : 2 ∗ pi;<br />
≫ polar(x, sin(2 ∗ x)), grid<br />
[1] –, “<strong>Matlab</strong>7 Graphics”, The MathWorks, 2007.<br />
[2] –, “<strong>Matlab</strong>7 Programming”, The MathWorks, 2007.<br />
[3] –, “<strong>Matlab</strong>7 3-D Visualization”, The MathWorks, 2007.<br />
[4] B. Hahn and D. T. Valentine, “Essential <strong>Matlab</strong> For Engineers and Scientists”, Elsevier,<br />
third edition, 2007.<br />
[5] D. J. Higham and N. J. Higham, “<strong>Matlab</strong> Guide”, SIAM puplications, 2000.<br />
12