Matlab Chapter6.pdf
Matlab Chapter6.pdf
Matlab Chapter6.pdf
Create successful ePaper yourself
Turn your PDF publications into a flip-book with our unique Google optimized e-Paper software.
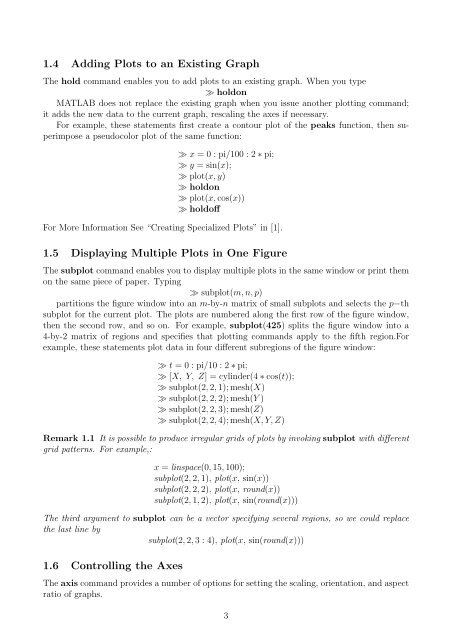
1.4 Adding Plots to an Existing Graph<br />
The hold command enables you to add plots to an existing graph. When you type<br />
≫ holdon<br />
MATLAB does not replace the existing graph when you issue another plotting command;<br />
it adds the new data to the current graph, rescaling the axes if necessary.<br />
For example, these statements first create a contour plot of the peaks function, then superimpose<br />
a pseudocolor plot of the same function:<br />
≫ x = 0 : pi/100 : 2 ∗ pi;<br />
≫ y = sin(x);<br />
≫ plot(x, y)<br />
≫ holdon<br />
≫ plot(x, cos(x))<br />
≫ holdoff<br />
For More Information See “Creating Specialized Plots” in [1].<br />
1.5 Displaying Multiple Plots in One Figure<br />
The subplot command enables you to display multiple plots in the same window or print them<br />
on the same piece of paper. Typing<br />
≫ subplot(m, n, p)<br />
partitions the figure window into an m-by-n matrix of small subplots and selects the p−th<br />
subplot for the current plot. The plots are numbered along the first row of the figure window,<br />
then the second row, and so on. For example, subplot(425) splits the figure window into a<br />
4-by-2 matrix of regions and specifies that plotting commands apply to the fifth region.For<br />
example, these statements plot data in four different subregions of the figure window:<br />
≫ t = 0 : pi/10 : 2 ∗ pi;<br />
≫ [X, Y, Z] = cylinder(4 ∗ cos(t));<br />
≫ subplot(2, 2, 1); mesh(X)<br />
≫ subplot(2, 2, 2); mesh(Y )<br />
≫ subplot(2, 2, 3); mesh(Z)<br />
≫ subplot(2, 2, 4); mesh(X, Y, Z)<br />
Remark 1.1 It is possible to produce irregular grids of plots by invoking subplot with different<br />
grid patterns. For example,:<br />
x = linspace(0, 15, 100);<br />
subplot(2, 2, 1), plot(x, sin(x))<br />
subplot(2, 2, 2), plot(x, round(x))<br />
subplot(2, 1, 2), plot(x, sin(round(x)))<br />
The third argument to subplot can be a vector specifying several regions, so we could replace<br />
the last line by<br />
subplot(2, 2, 3 : 4), plot(x, sin(round(x)))<br />
1.6 Controlling the Axes<br />
The axis command provides a number of options for setting the scaling, orientation, and aspect<br />
ratio of graphs.<br />
3


