United States DEPARTMENT of Commerce
United States DEPARTMENT of Commerce
United States DEPARTMENT of Commerce

You also want an ePaper? Increase the reach of your titles
YUMPU automatically turns print PDFs into web optimized ePapers that Google loves.
A P P E N D I x C : P e r f o r m a n c e M e a s u r e s D e f i n i t i o n s<br />
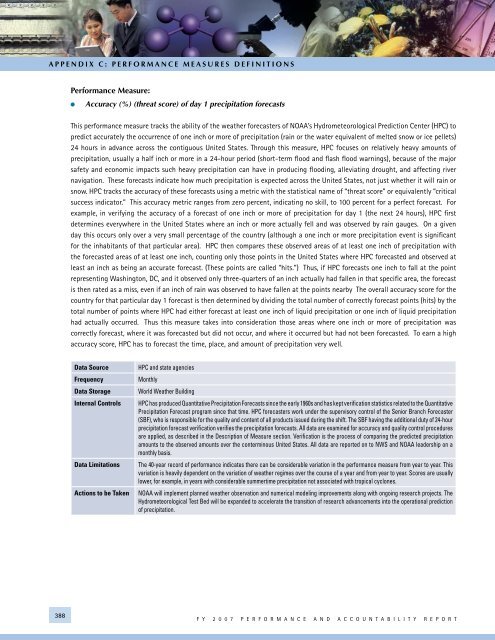
Performance Measure:<br />
Accuracy (%) (threat score) <strong>of</strong> day 1 precipitation forecasts<br />
This performance measure tracks the ability <strong>of</strong> the weather forecasters <strong>of</strong> NOAA’s Hydrometeorological Prediction Center (HPC) to<br />
predict accurately the occurrence <strong>of</strong> one inch or more <strong>of</strong> precipitation (rain or the water equivalent <strong>of</strong> melted snow or ice pellets)<br />
24 hours in advance across the contiguous <strong>United</strong> <strong>States</strong>. Through this measure, HPC focuses on relatively heavy amounts <strong>of</strong><br />
precipitation, usually a half inch or more in a 24-hour period (short-term flood and flash flood warnings), because <strong>of</strong> the major<br />
safety and economic impacts such heavy precipitation can have in producing flooding, alleviating drought, and affecting river<br />
navigation. These forecasts indicate how much precipitation is expected across the <strong>United</strong> <strong>States</strong>, not just whether it will rain or<br />
snow. HPC tracks the accuracy <strong>of</strong> these forecasts using a metric with the statistical name <strong>of</strong> “threat score” or equivalently “critical<br />
success indicator.” This accuracy metric ranges from zero percent, indicating no skill, to 100 percent for a perfect forecast. For<br />
example, in verifying the accuracy <strong>of</strong> a forecast <strong>of</strong> one inch or more <strong>of</strong> precipitation for day 1 (the next 24 hours), HPC first<br />
determines everywhere in the <strong>United</strong> <strong>States</strong> where an inch or more actually fell and was observed by rain gauges. On a given<br />
day this occurs only over a very small percentage <strong>of</strong> the country (although a one inch or more precipitation event is significant<br />
for the inhabitants <strong>of</strong> that particular area). HPC then compares these observed areas <strong>of</strong> at least one inch <strong>of</strong> precipitation with<br />
the forecasted areas <strong>of</strong> at least one inch, counting only those points in the <strong>United</strong> <strong>States</strong> where HPC forecasted and observed at<br />
least an inch as being an accurate forecast. (These points are called “hits.”) Thus, if HPC forecasts one inch to fall at the point<br />
representing Washington, DC, and it observed only three-quarters <strong>of</strong> an inch actually had fallen in that specific area, the forecast<br />
is then rated as a miss, even if an inch <strong>of</strong> rain was observed to have fallen at the points nearby The overall accuracy score for the<br />
country for that particular day 1 forecast is then determined by dividing the total number <strong>of</strong> correctly forecast points (hits) by the<br />
total number <strong>of</strong> points where HPC had either forecast at least one inch <strong>of</strong> liquid precipitation or one inch <strong>of</strong> liquid precipitation<br />
had actually occurred. Thus this measure takes into consideration those areas where one inch or more <strong>of</strong> precipitation was<br />
correctly forecast, where it was forecasted but did not occur, and where it occurred but had not been forecasted. To earn a high<br />
accuracy score, HPC has to forecast the time, place, and amount <strong>of</strong> precipitation very well.<br />
Data Source<br />
Frequency<br />
Data Storage<br />
Internal Controls<br />
Data Limitations<br />
Actions to be Taken<br />
HPC and state agencies<br />
Monthly<br />
World Weather Building<br />
HPC has produced Quantitative Precipitation Forecasts since the early 1960s and has kept verification statistics related to the Quantitative<br />
Precipitation Forecast program since that time. HPC forecasters work under the supervisory control <strong>of</strong> the Senior Branch Forecaster<br />
(SBF), who is responsible for the quality and content <strong>of</strong> all products issued during the shift. The SBF having the additional duty <strong>of</strong> 24-hour<br />
precipitation forecast verification verifies the precipitation forecasts. All data are examined for accuracy and quality control procedures<br />
are applied, as described in the Description <strong>of</strong> Measure section. Verification is the process <strong>of</strong> comparing the predicted precipitation<br />
amounts to the observed amounts over the conterminous <strong>United</strong> <strong>States</strong>. All data are reported on to NWS and NOAA leadership on a<br />
monthly basis.<br />
The 40-year record <strong>of</strong> performance indicates there can be considerable variation in the performance measure from year to year. This<br />
variation is heavily dependent on the variation <strong>of</strong> weather regimes over the course <strong>of</strong> a year and from year to year. Scores are usually<br />
lower, for example, in years with considerable summertime precipitation not associated with tropical cyclones.<br />
NOAA will implement planned weather observation and numerical modeling improvements along with ongoing research projects. The<br />
Hydrometeorological Test Bed will be expanded to accelerate the transition <strong>of</strong> research advancements into the operational prediction<br />
<strong>of</strong> precipitation.<br />
388<br />
F Y 2 0 0 7 P E R F O R M A N C E A N D A C C O U N T A B I L I T Y R E P O R T