Read - Sa-Dhan
Read - Sa-Dhan
Read - Sa-Dhan

You also want an ePaper? Increase the reach of your titles
YUMPU automatically turns print PDFs into web optimized ePapers that Google loves.
Financial performance of CDFIs on basis of <strong>Sa</strong>-<strong>Dhan</strong> recommended financial performance benchmarks<br />
3.1 Peer group-based analysis<br />
Comparative analysis of CDFIs based on peer-grouping reveals some distinct features.<br />
The three categories of peer-groups used in this analysis are (a) Gross Loan portfolio (b) Client outreach<br />
and (c) Age (years of experience in microfinance).<br />
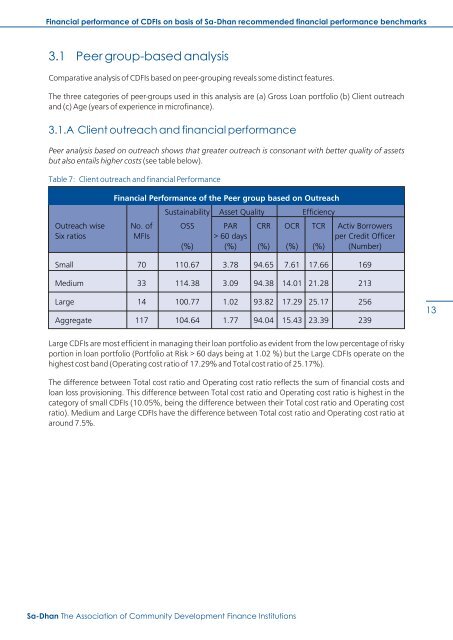
3.1.A Client outreach and financial performance<br />
Peer analysis based on outreach shows that greater outreach is consonant with better quality of assets<br />
but also entails higher costs (see table below).<br />
Table 7: Client outreach and financial Performance<br />
Financial Performance of the Peer group based on Outreach<br />
Sustainability Asset Quality Efficiency<br />
Outreach wise No. of OSS PAR CRR OCR TCR Activ Borrowers<br />
Six ratios MFIs > 60 days per Credit Officer<br />
(%) (%) (%) (%) (%) (Number)<br />
Small 70 110.67 3.78 94.65 7.61 17.66 169<br />
Medium 33 114.38 3.09 94.38 14.01 21.28 213<br />
Large 14 100.77 1.02 93.82 17.29 25.17 256<br />
Aggregate 117 104.64 1.77 94.04 15.43 23.39 239<br />
13<br />
Large CDFIs are most efficient in managing their loan portfolio as evident from the low percentage of risky<br />
portion in loan portfolio (Portfolio at Risk > 60 days being at 1.02 %) but the Large CDFIs operate on the<br />
highest cost band (Operating cost ratio of 17.29% and Total cost ratio of 25.17%).<br />
The difference between Total cost ratio and Operating cost ratio reflects the sum of financial costs and<br />
loan loss provisioning. This difference between Total cost ratio and Operating cost ratio is highest in the<br />
category of small CDFIs (10.05%, being the difference between their Total cost ratio and Operating cost<br />
ratio). Medium and Large CDFIs have the difference between Total cost ratio and Operating cost ratio at<br />
around 7.5%.<br />
<strong>Sa</strong>-<strong>Dhan</strong> The Association of Community Development Finance Institutions