Read - Sa-Dhan
Read - Sa-Dhan
Read - Sa-Dhan

You also want an ePaper? Increase the reach of your titles
YUMPU automatically turns print PDFs into web optimized ePapers that Google loves.
Financial performance of CDFIs on basis of <strong>Sa</strong>-<strong>Dhan</strong> recommended financial performance benchmarks<br />
median of 605. The concern of high ratio of Active borrowers to each credit officer therefore remains true.<br />
The Top-20 CDFIs have aggregate Active borrowers to credit officer ratio of 258. This is within the <strong>Sa</strong>-<br />
<strong>Dhan</strong> recommended range of 250 to 350. The range of Active borrowers to credit officer ratio among<br />
Top-20 CDFIs is between 144 and 548 with median of 258. The Top-20 CDFIs has one Macs and one Cooperative.<br />
The Macs has Active borrowers to credit officer ratio of 141 while Cooperative has Active<br />
borrowers to credit officer ratio of 548.<br />
The High Growth CDFIs have Active borrowers to credit officer ratio of 310 with median of 298. This is<br />
considerably high compared to Active borrowers to credit officer ratio of 239 in the overall sample.<br />
Clearly, issues of location, client services and process controls are important.<br />
CDFIs would need to consider the aspects of staff productivity, client servicing and location strategies<br />
(saturation, deepening, urban/ rural centres) as co-related issues in achieving financial efficiency.<br />
Methodology and client coverage would be the key to providing services to clients adequately and achieve<br />
financial efficiency.<br />
4.4 Mutually Aided Cooperative Society (MACs)<br />
The MACs, small and localised institutions, are distinct by their operational sustainability.<br />
The sample of 117 CDFIs comprises of 41 MACs. These MACs are located in the States of Andhra Pradesh<br />
and Orissa. One MACs falls in the peer group of 'Large' by GLP; all other MACs are small and young.<br />
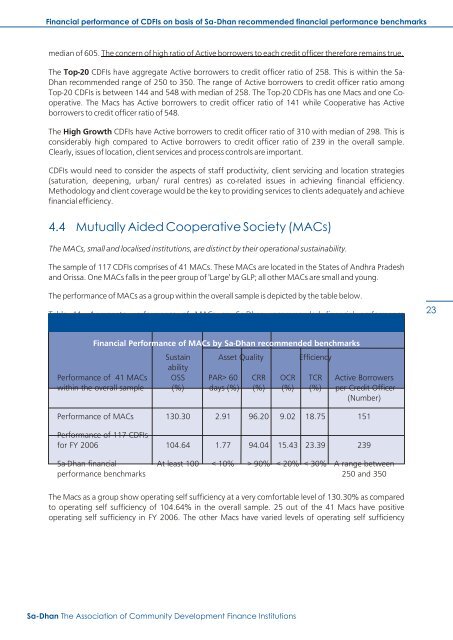
The performance of MACs as a group within the overall sample is depicted by the table below.<br />
Table 11: Aggregate performance of MACs on <strong>Sa</strong>-<strong>Dhan</strong> recommended financial performance<br />
benchmarks<br />
23<br />
Financial Performance of MACs by <strong>Sa</strong>-<strong>Dhan</strong> recommended benchmarks<br />
Sustain Asset Quality Efficiency<br />
ability<br />
Performance of 41 MACs OSS PAR> 60 CRR OCR TCR Active Borrowers<br />
within the overall sample (%) days (%) (%) (%) (%) per Credit Officer<br />
(Number)<br />
Performance of MACs 130.30 2.91 96.20 9.02 18.75 151<br />
Performance of 117 CDFIs<br />
for FY 2006 104.64 1.77 94.04 15.43 23.39 239<br />
<strong>Sa</strong>-<strong>Dhan</strong> financial At least 100 < 10% > 90% < 20% < 30% A range between<br />
performance benchmarks 250 and 350<br />
The Macs as a group show operating self sufficiency at a very comfortable level of 130.30% as compared<br />
to operating self sufficiency of 104.64% in the overall sample. 25 out of the 41 Macs have positive<br />
operating self sufficiency in FY 2006. The other Macs have varied levels of operating self sufficiency<br />
<strong>Sa</strong>-<strong>Dhan</strong> The Association of Community Development Finance Institutions