Read - Sa-Dhan
Read - Sa-Dhan
Read - Sa-Dhan

Create successful ePaper yourself
Turn your PDF publications into a flip-book with our unique Google optimized e-Paper software.
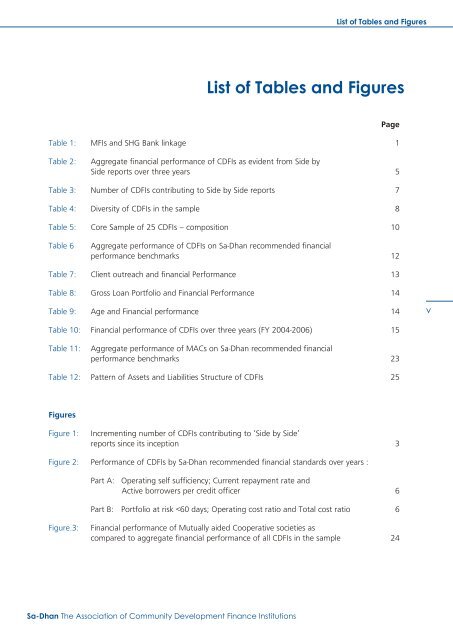
List of Tables and Figures<br />
List of Tables and Figures<br />
Page<br />
Table 1:<br />
Table 2:<br />
Table 3:<br />
Table 4:<br />
Table 5:<br />
Table 6<br />
Table 7:<br />
Table 8:<br />
Table 9:<br />
Table 10:<br />
Table 11:<br />
Table 12:<br />
MFIs and SHG Bank linkage 1<br />
Aggregate financial performance of CDFIs as evident from Side by<br />
Side reports over three years 5<br />
Number of CDFIs contributing to Side by Side reports 7<br />
Diversity of CDFIs in the sample 8<br />
Core <strong>Sa</strong>mple of 25 CDFIs – composition 10<br />
Aggregate performance of CDFIs on <strong>Sa</strong>-<strong>Dhan</strong> recommended financial<br />
performance benchmarks 12<br />
Client outreach and financial Performance 13<br />
Gross Loan Portfolio and Financial Performance 14<br />
Age and Financial performance 14<br />
Financial performance of CDFIs over three years (FY 2004-2006) 15<br />
Aggregate performance of MACs on <strong>Sa</strong>-<strong>Dhan</strong> recommended financial<br />
performance benchmarks 23<br />
Pattern of Assets and Liabilities Structure of CDFIs 25<br />
v<br />
Figures<br />
Figure 1:<br />
Figure 2:<br />
Incrementing number of CDFIs contributing to ‘Side by Side’<br />
reports since its inception 3<br />
Performance of CDFIs by <strong>Sa</strong>-<strong>Dhan</strong> recommended financial standards over years :<br />
Part A:<br />
Operating self sufficiency; Current repayment rate and<br />
Active borrowers per credit officer 6<br />
Part B: Portfolio at risk