Read - Sa-Dhan
Read - Sa-Dhan
Read - Sa-Dhan

You also want an ePaper? Increase the reach of your titles
YUMPU automatically turns print PDFs into web optimized ePapers that Google loves.
Financial performance of CDFIs on basis of <strong>Sa</strong>-<strong>Dhan</strong> recommended financial performance benchmarks<br />
‘C’ category CDFIs (experience of 10 years and more) have highest (PAR > 60 days at 4.31%) but also the<br />
highest differential rate (10.37 % being difference between Total cost ratio at 23.20% and Operating cost<br />
9<br />
ratio at 12.83%). ‘B’ category CDFIs (experience of between 5 and 10 years) manage their assets well<br />
(Portfolio at risk > 60 days at 1.46%). ‘A’ category CDFIs (experience of between 5 years or less) has poor<br />
Current repayment rate (75.58%) and highest ratio of Active borrowers to Credit officer (273).<br />
Operating costs across CDFIs have apparently stabilized. The overall costs among CDFIs reveal that<br />
financial costs and loan loss provisioning are significant and have driven costs up. This is significantly true<br />
for Small CDFIs (Small by outreach and Gross loan portfolio). Managing risky assets remains a challenge.<br />
3.2 Financial performance of the core sample<br />
How have CDFIs moved over years.<br />
The core sample of 25 CDFIs reveal the trends over three year period of FY 2004 to FY 2006.<br />
There are clearly some good signals. Financial management has improved, readjustments have been<br />
achieved. This is reflected in quality of assets and operational efficiency. It is evident that process<br />
adjustments and refinements in costs and yield have been undertaken during FY 2005 and FY 2006.<br />
The table below captures financial performance of the CDFIs forming the core sample.<br />
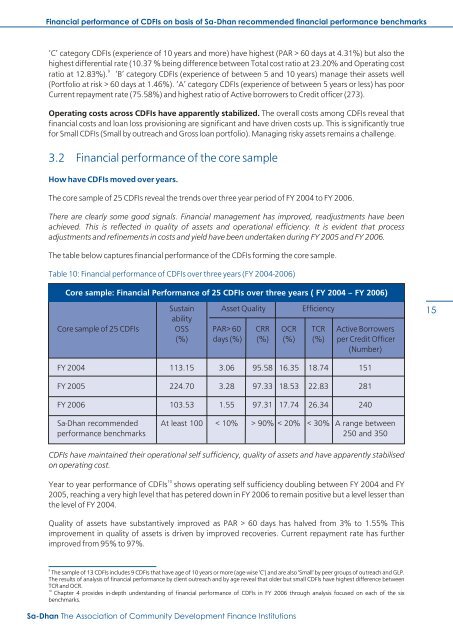
Table 10: Financial performance of CDFIs over three years (FY 2004-2006)<br />
Core sample: Financial Performance of 25 CDFIs over three years ( FY 2004 – FY 2006)<br />
Sustain Asset Quality Efficiency<br />
ability<br />
Core sample of 25 CDFIs OSS PAR> 60 CRR OCR TCR Active Borrowers<br />
(%) days (%) (%) (%) (%) per Credit Officer<br />
(Number)<br />
15<br />
FY 2004 113.15 3.06 95.58 16.35 18.74 151<br />
FY 2005 224.70 3.28 97.33 18.53 22.83 281<br />
FY 2006 103.53 1.55 97.31 17.74 26.34 240<br />
<strong>Sa</strong>-<strong>Dhan</strong> recommended At least 100 < 10% > 90% < 20% < 30% A range between<br />
performance benchmarks 250 and 350<br />
CDFIs have maintained their operational self sufficiency, quality of assets and have apparently stabilised<br />
on operating cost.<br />
10<br />
Year to year performance of CDFIs shows operating self sufficiency doubling between FY 2004 and FY<br />
2005, reaching a very high level that has petered down in FY 2006 to remain positive but a level lesser than<br />
the level of FY 2004.<br />
Quality of assets have substantively improved as PAR > 60 days has halved from 3% to 1.55% This<br />
improvement in quality of assets is driven by improved recoveries. Current repayment rate has further<br />
improved from 95% to 97%.<br />
9<br />
The sample of 13 CDFIs includes 9 CDFIs that have age of 10 years or more (age-wise 'C') and are also 'Small' by peer groups of outreach and GLP.<br />
The results of analysis of financial performance by client outreach and by age reveal that older but small CDFIs have highest difference between<br />
TCR and OCR.<br />
10<br />
Chapter 4 provides in-depth understanding of financial performance of CDFIs in FY 2006 through analysis focused on each of the six<br />
benchmarks.<br />
<strong>Sa</strong>-<strong>Dhan</strong> The Association of Community Development Finance Institutions