

Portfolio report - Mangaung.co.za
Portfolio report - Mangaung.co.za
Portfolio report - Mangaung.co.za

Create successful ePaper yourself
Turn your PDF publications into a flip-book with our unique Google optimized e-Paper software.
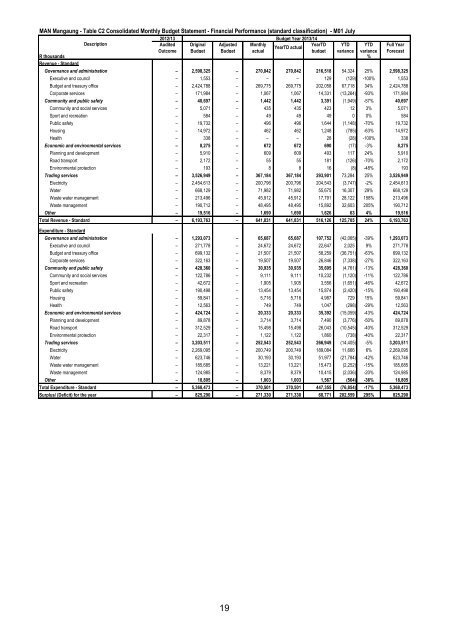
MAN <strong>Mangaung</strong> - Table C2 Consolidated Monthly Budget Statement - Financial Performance (standard classification) - M01 July<br />
2012/13 Budget Year 2013/14<br />
Description<br />
Audited Original Adjusted Monthly<br />
YearTD YTD YTD<br />
YearTD actual<br />
Out<strong>co</strong>me Budget Budget actual<br />
budget variance variance<br />
R thousands %<br />
Revenue - Standard<br />
Full Year<br />
Forecast<br />
Governance and administration – 2,598,325 – 270,842 270,842 216,518 54,324 25% 2,598,325<br />
Executive and <strong>co</strong>uncil – 1,553 – – – 129 (129) -100% 1,553<br />
Budget and treasury office – 2,424,788 – 269,775 269,775 202,058 67,718 34% 2,424,788<br />
Corporate services – 171,984 – 1,067 1,067 14,331 (13,264) -93% 171,984<br />
Community and public safety – 40,697 – 1,442 1,442 3,391 (1,949) -57% 40,697<br />
Community and social services – 5,071 – 435 435 423 12 3% 5,071<br />
Sport and recreation – 584 – 49 49 49 0 0% 584<br />
Public safety – 19,732 – 496 496 1,644 (1,148) -70% 19,732<br />
Housing – 14,972 – 462 462 1,248 (785) -63% 14,972<br />
Health – 338 – – – 28 (28) -100% 338<br />
E<strong>co</strong>nomic and environmental services – 8,275 – 672 672 690 (17) -3% 8,275<br />
Planning and development – 5,910 – 609 609 493 117 24% 5,910<br />
Road transport – 2,172 – 55 55 181 (126) -70% 2,172<br />
Environmental protection – 193 – 8 8 16 (8) -48% 193<br />
Trading services – 3,526,949 – 367,184 367,184 293,901 73,284 25% 3,526,949<br />
Electricity – 2,454,613 – 200,796 200,796 204,543 (3,747) -2% 2,454,613<br />
Water – 668,129 – 71,982 71,982 55,675 16,307 29% 668,129<br />
Waste water management – 213,496 – 45,912 45,912 17,791 28,122 158% 213,496<br />
Waste management – 190,712 – 48,495 48,495 15,892 32,603 205% 190,712<br />
Other – 19,516 – 1,690 1,690 1,626 63 4% 19,516<br />
Total Revenue - Standard – 6,193,763 – 641,831 641,831 516,126 125,705 24% 6,193,763<br />
Expenditure - Standard<br />
Governance and administration – 1,293,073 – 65,687 65,687 107,752 (42,065) -39% 1,293,073<br />
Executive and <strong>co</strong>uncil – 271,778 – 24,672 24,672 22,647 2,025 9% 271,778<br />
Budget and treasury office – 699,132 – 21,507 21,507 58,259 (36,751) -63% 699,132<br />
Corporate services – 322,163 – 19,507 19,507 26,846 (7,338) -27% 322,163<br />
Community and public safety – 428,360 – 30,935 30,935 35,695 (4,761) -13% 428,360<br />
Community and social services – 122,786 – 9,111 9,111 10,232 (1,120) -11% 122,786<br />
Sport and recreation – 42,672 – 1,905 1,905 3,556 (1,651) -46% 42,672<br />
Public safety – 190,498 – 13,454 13,454 15,874 (2,420) -15% 190,498<br />
Housing – 59,841 – 5,716 5,716 4,987 729 15% 59,841<br />
Health – 12,563 – 749 749 1,047 (298) -29% 12,563<br />
E<strong>co</strong>nomic and environmental services – 424,724 – 20,333 20,333 35,392 (15,059) -43% 424,724<br />
Planning and development – 89,878 – 3,714 3,714 7,490 (3,776) -50% 89,878<br />
Road transport – 312,529 – 15,498 15,498 26,043 (10,545) -40% 312,529<br />
Environmental protection – 22,317 – 1,122 1,122 1,860 (738) -40% 22,317<br />
Trading services – 3,203,511 – 252,543 252,543 266,949 (14,405) -5% 3,203,511<br />
Electricity – 2,269,095 – 200,749 200,749 189,084 11,666 6% 2,269,095<br />
Water – 623,746 – 30,193 30,193 51,977 (21,784) -42% 623,746<br />
Waste water management – 185,685 – 13,221 13,221 15,473 (2,252) -15% 185,685<br />
Waste management – 124,985 – 8,379 8,379 10,415 (2,036) -20% 124,985<br />
Other – 18,805 – 1,003 1,003 1,567 (564) -36% 18,805<br />
Total Expenditure - Standard – 5,368,473 – 370,501 370,501 447,355 (76,854) -17% 5,368,473<br />
Surplus/ (Deficit) for the year – 825,290 – 271,330 271,330 68,771 202,559 295% 825,290<br />
19


