Expenditure by Vote – Vote 1 - City Manager – 47,514 – 2,179 2,179 3,959 (1,781) -45% 47,514 1.1 - Office of the City Manager 11,314 427 427 943 (516) -55% 11,314 1.2 - Deputy Executive Director Operations 9,546 424 424 795 (372) -47% 9,546 1.3 - Information Technology and Management – – – – – – 1.4 - Committee Services – – – – – – 1.5 - Deputy Executive Director Performance 9,468 326 326 789 (463) -59% 9,468 1.6 - Risk Management and anti-Fraud & Corruption 8,057 504 504 671 (168) -25% 8,057 1.7 - Internal Audit 7,442 498 498 620 (122) -20% 7,442 1.8 - Institutional Compliance 1,687 – – 141 (141) -100% 1,687 Vote 2 - Executive Mayor – 157,524 – 19,633 19,633 13,126 6,506 50% 157,524 2.1 - Office of the Speaker 89,326 15,688 15,688 7,444 8,245 111% 89,326 2.2 - Office of the Executive Mayor 63,123 3,554 3,554 5,260 (1,706) -32% 63,123 2.3 - Office of the Councils Whip 5,076 390 390 423 (33) -8% 5,076 Vote 3 - Corporate Services – 273,911 – 14,925 14,925 22,825 (7,900) -35% 273,911 3.1 - Head 7,604 256 256 634 (378) -60% 7,604 3.2 - Human Resource Management & Development 46,371 3,391 3,391 3,864 (473) -12% 46,371 3.3 - Office of the Speaker – – – – – – 3.4 - Office of the Executive Mayor – – – – – – 3.5 - Labour Relations 6,571 – – 548 (548) -100% 6,571 3.6 - Communications and Legal Services 8,516 732 732 710 23 3% 8,516 3.7 - Facilities Management 104,938 4,720 4,720 8,744 (4,025) -46% 104,938 3.8 - Safety and Loss Control 2,158 104 104 180 (76) -42% 2,158 3.9 - Committee Services 19,181 1,214 1,214 1,598 (385) -24% 19,181 3.10 - Information Technology and Management 78,571 4,508 4,508 6,547 (2,039) -31% 78,571 Vote 4 - Finance – 187,575 – 6,028 6,028 15,631 (9,603) -61% 187,575 4.1 - Property Rates – – – – – – 4.2 - Chief Financial Officer 9,177 756 756 765 (9) -1% 9,177 4.3 - Ac<strong>co</strong>unting and Compliance 3,867 30 30 322 (292) -91% 3,867 4.4 - Financial Support 2,030 174 174 169 5 3% 2,030 4.5 - Budget and Treasury 7,223 444 444 602 (157) -26% 7,223 4.6 - Supply Chain Management 21,338 1,093 1,093 1,778 (685) -39% 21,338 4.7 - Revenue Management 133,118 3,247 3,247 11,093 (7,846) -71% 133,118 4.8 - Asset Management 10,822 284 284 902 (617) -68% 10,822 Vote 5 - Social Services – 340,418 – 24,001 24,001 28,367 (4,366) -15% 340,418 5.1 - Administration 6,586 518 518 549 (31) -6% 6,586 5.2 - Education and Library Services – – – – – – 5.3 - Social Development 57,948 3,247 3,247 4,829 (1,582) -33% 57,948 5.4 - Environmental Health Services – – – – – – 5.5 - Emergency Management Services 58,166 4,383 4,383 4,847 (464) -10% 58,166 5.6 - Traffic and Law Enforcement 117,130 8,114 8,114 9,760 (1,646) -17% 117,130 5.7 - Parks and Cemeteries 95,173 7,500 7,500 7,931 (431) -5% 95,173 5.8 - Health 5,414 238 238 451 (213) -47% 5,414 Vote 6 - Planning – 100,934 – 4,178 4,178 8,411 (4,233) -50% 100,934 6.1 - Administration and Finance 6,614 357 357 551 (195) -35% 6,614 6.2 - Planning – – – – – – 6.3 - E<strong>co</strong>nomic Development – – – – – – 6.4 - Town and Regional Planning 34,314 647 647 2,859 (2,212) -77% 34,314 6.5 - Land Use Control 17,730 1,209 1,209 1,477 (268) -18% 17,730 6.6 - Architectural and Survey Services 4,744 300 300 395 (96) -24% 4,744 6.7 - Geographic Information Services 3,998 137 137 333 (196) -59% 3,998 6.8 - Environmental Management 4,442 107 107 370 (263) -71% 4,442 6.3 - E<strong>co</strong>nomic Development 29,092 1,420 1,420 2,424 (1,005) -41% 29,092 Vote 7 - Human Settlement and Housing – 94,279 – 6,751 6,751 7,856 (1,106) -14% 94,279 7.1 - Head 17,914 3,138 3,138 1,493 1,645 110% 17,914 7.2 - Rental and Social Housing 13,629 741 741 1,136 (395) -35% 13,629 7.3 - Land Development and Property Management 34,438 1,035 1,035 2,870 (1,835) -64% 34,438 7.4 - Implementation Support 3,689 174 174 307 (133) -43% 3,689 7.5 - BNG Property Management – 95 95 – 95 #DIV/0! – 7.6 - Informal Settlements 24,609 1,568 1,568 2,051 (483) -24% 24,609 7.7 - Housing – – – – – – Vote 8 - Fresh Produce Market – 18,428 – 1,002 1,002 1,536 (533) -35% 18,428 8.1 - Administration 5,103 267 267 425 (159) -37% 5,103 8.2 - Business Operations 13,325 736 736 1,110 (375) -34% 13,325 Vote 9 - Engineering Services – 668,370 – 42,298 42,298 55,695 (13,397) -24% 668,370 9.1 - Head 4,716 305 305 393 (88) -22% 4,716 9.2 - Fleet Sevices and Engineering Support 42,050 4,956 4,956 3,504 1,452 41% 42,050 9.3 - Roads and Stormwater 310,934 15,437 15,437 25,910 (10,474) -40% 310,934 9.4 - Solid Waste Management 124,985 8,379 8,379 10,415 (2,036) -20% 124,985 9.5 - Water and Sanitation 185,685 13,221 13,221 15,473 (2,252) -15% 185,685 Vote 10 - Water Services – 623,746 – 30,193 30,193 51,977 (21,784) -42% 623,746 10.1 - Water 623,746 30,193 30,193 51,977 (21,784) -42% 623,746 Vote 11 - Miscellaneous Services – 520,734 – 16,235 16,235 43,393 (27,158) -63% 520,734 11.1 - Transfers, Grants and Miscellaneous 520,734 16,235 16,235 43,393 (27,158) -63% 520,734 Vote 12 - Regional Operations – – – – – – – – 12.1 - Administration – – – – – – 12.2 - Bloemfontein North – – – – – – 12.3 - Bloemfontein South – – – – – – 12.4 - Botshabelo – – – – – – 12.5 - Thaba Nchu – – – – – – Vote 13 - Strategic Projects and Service Delivery Regulation – 54,562 – 1,549 1,549 4,547 (2,998) -66% 54,562 13.1 - Head 4,381 334 334 365 (32) -9% 4,381 13.2 - Strategic Projects 14,200 2 2 1,183 (1,181) -100% 14,200 13.3 - City Services, Monitoring and Evaluation 3,152 – – 263 (263) -100% 3,152 13.4 - Regional Centre Bloemfontein 18,004 680 680 1,500 (820) -55% 18,004 13.5 - Regional Centre Botshabelo 8,598 413 413 717 (304) -42% 8,598 13.6 - Regional Centre Thaba Nchu 6,227 121 121 519 (398) -77% 6,227 Vote 14 - Electricity - Centlec (Soc) Ltd – 2,280,477 – 201,530 201,530 190,032 11,497 6% 2,280,477 14.1 - Board of Directors 2,627 42 42 219 (177) -81% 2,627 14.2 - Company Secretary 3,688 26 26 307 (282) -92% 3,688 14.3 - Chief Executive Officer 48,428 1,171 1,171 4,036 (2,864) -71% 48,428 14.4 - Finance 649,793 48,455 48,455 54,147 (5,692) -11% 649,793 14.5 - Corporate Services 54,004 1,988 1,988 4,500 (2,512) -56% 54,004 14.6 - Engineering 23,803 847 847 1,984 (1,136) -57% 23,803 14.7 - Customer Services 92,135 3,771 3,771 7,678 (3,907) -51% 92,135 14.8 - Design and Development 34,354 1,293 1,293 2,863 (1,570) -55% 34,354 14.9 - Distribution 1,360,262 143,157 143,157 113,351 29,806 26% 1,360,262 14.10 - Street Lights 11,382 780 780 948 (168) -18% 11,382 Total Expenditure by Vote – 5,368,473 – 370,501 370,501 447,355 (76,854) – (0) 5,368,473 Surplus/ (Deficit) for the year – 825,290 – 271,330 271,330 68,771 202,559 0 825,290 24
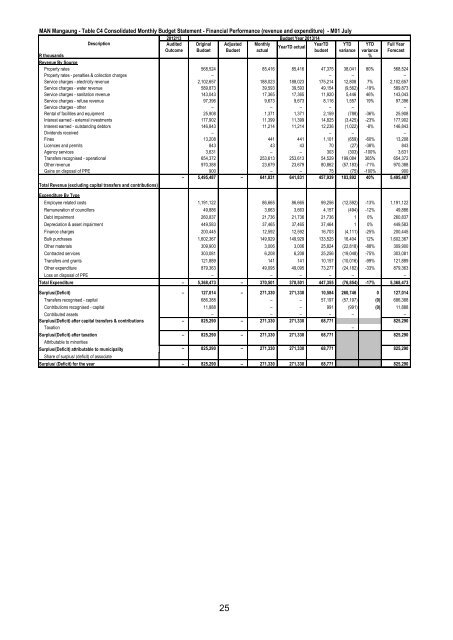
MAN <strong>Mangaung</strong> - Table C4 Consolidated Monthly Budget Statement - Financial Performance (revenue and expenditure) - M01 July 2012/13 Budget Year 2013/14 Description Audited Original Adjusted Monthly YearTD YTD YTD Full Year YearTD actual Out<strong>co</strong>me Budget Budget actual budget variance variance Forecast R thousands % Revenue By Source Property rates 568,524 85,416 85,416 47,375 38,041 80% 568,524 Property rates - penalties & <strong>co</strong>llection charges – – – – Service charges - electricity revenue 2,102,657 188,023 188,023 175,214 12,808 7% 2,102,657 Service charges - water revenue 589,873 39,593 39,593 49,154 (9,562) -19% 589,873 Service charges - sanitation revenue 143,043 17,365 17,365 11,920 5,446 46% 143,043 Service charges - refuse revenue 97,396 9,673 9,673 8,116 1,557 19% 97,396 Service charges - other – – – – – – Rental of facilities and equipment 25,908 1,371 1,371 2,159 (788) -36% 25,908 Interest earned - external investments 177,902 11,399 11,399 14,825 (3,425) -23% 177,902 Interest earned - outstanding debtors 146,843 11,214 11,214 12,236 (1,022) -8% 146,843 Dividends received – – – – Fines 13,208 441 441 1,101 (659) -60% 13,208 Licences and permits 843 43 43 70 (27) -38% 843 Agency services 3,631 – – 303 (303) -100% 3,631 Transfers re<strong>co</strong>gnised - operational 654,372 253,613 253,613 54,529 199,084 365% 654,372 Other revenue 970,388 23,679 23,679 80,862 (57,183) -71% 970,388 Gains on disposal of PPE 900 – – 75 (75) -100% 900 – 5,495,487 – 641,831 641,831 457,939 183,892 40% 5,495,487 Total Revenue (excluding capital transfers and <strong>co</strong>ntributions) Expenditure By Type Employee related <strong>co</strong>sts 1,191,122 86,665 86,665 99,256 (12,592) -13% 1,191,122 Remuneration of <strong>co</strong>uncillors 49,886 3,663 3,663 4,157 (494) -12% 49,886 Debt impairment 260,837 21,736 21,736 21,736 1 0% 260,837 Depreciation & asset impairment 449,583 37,465 37,465 37,464 1 0% 449,583 Finance charges 200,445 12,592 12,592 16,703 (4,111) -25% 200,445 Bulk purchases 1,602,367 149,929 149,929 133,525 16,404 12% 1,602,367 Other materials 309,900 3,006 3,006 25,824 (22,818) -88% 309,900 Contracted services 303,081 6,208 6,208 25,256 (19,048) -75% 303,081 Transfers and grants 121,889 141 141 10,157 (10,016) -99% 121,889 Other expenditure 879,363 49,095 49,095 73,277 (24,182) -33% 879,363 Loss on disposal of PPE – – – – – – Total Expenditure – 5,368,473 – 370,501 370,501 447,355 (76,854) -17% 5,368,473 Surplus/(Deficit) – 127,014 – 271,330 271,330 10,584 260,746 0 127,014 Transfers re<strong>co</strong>gnised - capital 686,388 – – 57,197 (57,197) (0) 686,388 Contributions re<strong>co</strong>gnised - capital 11,888 – – 991 (991) (0) 11,888 Contributed assets – – – – – – Surplus/(Deficit) after capital transfers & <strong>co</strong>ntributions – 825,290 – 271,330 271,330 68,771 825,290 Taxation – Surplus/(Deficit) after taxation – 825,290 – 271,330 271,330 68,771 825,290 Attributable to minorities Surplus/(Deficit) attributable to municipality – 825,290 – 271,330 271,330 68,771 825,290 Share of surplus/ (deficit) of associate Surplus/ (Deficit) for the year – 825,290 – 271,330 271,330 68,771 825,290 25