

Portfolio report - Mangaung.co.za
Portfolio report - Mangaung.co.za
Portfolio report - Mangaung.co.za

Create successful ePaper yourself
Turn your PDF publications into a flip-book with our unique Google optimized e-Paper software.
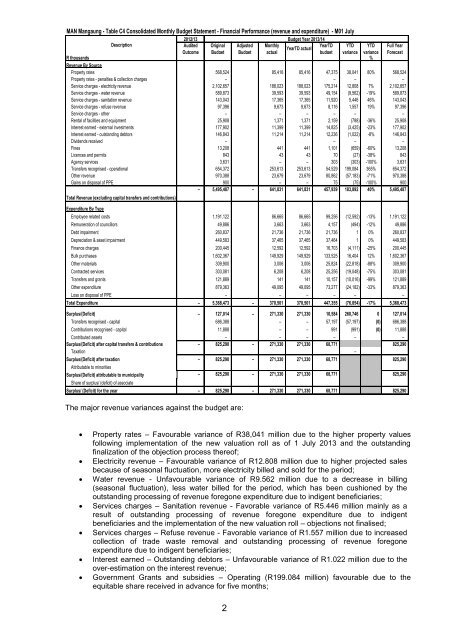
MAN <strong>Mangaung</strong> - Table C4 Consolidated Monthly Budget Statement - Financial Performance (revenue and expenditure) - M01 July<br />
2012/13<br />
Budget Year 2013/14<br />
Description<br />
Audited Original Adjusted Monthly<br />
YearTD YTD YTD Full Year<br />
YearTD actual<br />
Out<strong>co</strong>me Budget Budget actual<br />
budget variance variance Forecast<br />
R thousands %<br />
Revenue By Source<br />
Property rates 568,524 85,416 85,416 47,375 38,041 80% 568,524<br />
Property rates - penalties & <strong>co</strong>llection charges – – – –<br />
Service charges - electricity revenue 2,102,657 188,023 188,023 175,214 12,808 7% 2,102,657<br />
Service charges - water revenue 589,873 39,593 39,593 49,154 (9,562) -19% 589,873<br />
Service charges - sanitation revenue 143,043 17,365 17,365 11,920 5,446 46% 143,043<br />
Service charges - refuse revenue 97,396 9,673 9,673 8,116 1,557 19% 97,396<br />
Service charges - other – – – – – –<br />
Rental of facilities and equipment 25,908 1,371 1,371 2,159 (788) -36% 25,908<br />
Interest earned - external investments 177,902 11,399 11,399 14,825 (3,425) -23% 177,902<br />
Interest earned - outstanding debtors 146,843 11,214 11,214 12,236 (1,022) -8% 146,843<br />
Dividends received – – – –<br />
Fines 13,208 441 441 1,101 (659) -60% 13,208<br />
Licences and permits 843 43 43 70 (27) -38% 843<br />
Agency services 3,631 – – 303 (303) -100% 3,631<br />
Transfers re<strong>co</strong>gnised - operational 654,372 253,613 253,613 54,529 199,084 365% 654,372<br />
Other revenue 970,388 23,679 23,679 80,862 (57,183) -71% 970,388<br />
Gains on disposal of PPE 900 – – 75 (75) -100% 900<br />
– 5,495,487 – 641,831 641,831 457,939 183,892 40% 5,495,487<br />
Total Revenue (excluding capital transfers and <strong>co</strong>ntributions)<br />
Expenditure By Type<br />
Employee related <strong>co</strong>sts 1,191,122 86,665 86,665 99,256 (12,592) -13% 1,191,122<br />
Remuneration of <strong>co</strong>uncillors 49,886 3,663 3,663 4,157 (494) -12% 49,886<br />
Debt impairment 260,837 21,736 21,736 21,736 1 0% 260,837<br />
Depreciation & asset impairment 449,583 37,465 37,465 37,464 1 0% 449,583<br />
Finance charges 200,445 12,592 12,592 16,703 (4,111) -25% 200,445<br />
Bulk purchases 1,602,367 149,929 149,929 133,525 16,404 12% 1,602,367<br />
Other materials 309,900 3,006 3,006 25,824 (22,818) -88% 309,900<br />
Contracted services 303,081 6,208 6,208 25,256 (19,048) -75% 303,081<br />
Transfers and grants 121,889 141 141 10,157 (10,016) -99% 121,889<br />
Other expenditure 879,363 49,095 49,095 73,277 (24,182) -33% 879,363<br />
Loss on disposal of PPE – – – – – –<br />
Total Expenditure – 5,368,473 – 370,501 370,501 447,355 (76,854) -17% 5,368,473<br />
Surplus/(Deficit) – 127,014 – 271,330 271,330 10,584 260,746 0 127,014<br />
Transfers re<strong>co</strong>gnised - capital 686,388 – – 57,197 (57,197) (0) 686,388<br />
Contributions re<strong>co</strong>gnised - capital 11,888 – – 991 (991) (0) 11,888<br />
Contributed assets – – – – – –<br />
Surplus/(Deficit) after capital transfers & <strong>co</strong>ntributions – 825,290 – 271,330 271,330 68,771 825,290<br />
Taxation –<br />
Surplus/(Deficit) after taxation – 825,290 – 271,330 271,330 68,771 825,290<br />
Attributable to minorities<br />
Surplus/(Deficit) attributable to municipality – 825,290 – 271,330 271,330 68,771 825,290<br />
Share of surplus/ (deficit) of associate<br />
Surplus/ (Deficit) for the year – 825,290 – 271,330 271,330 68,771 825,290<br />
The major revenue variances against the budget are:<br />
<br />
<br />
<br />
<br />
<br />
<br />
<br />
Property rates – Favourable variance of R38,041 million due to the higher property values<br />
following implementation of the new valuation roll as of 1 July 2013 and the outstanding<br />
finali<strong>za</strong>tion of the objection process thereof;<br />
Electricity revenue – Favourable variance of R12.808 million due to higher projected sales<br />
because of seasonal fluctuation, more electricity billed and sold for the period;<br />
Water revenue - Unfavourable variance of R9.562 million due to a decrease in billing<br />
(seasonal fluctuation), less water billed for the period, which has been cushioned by the<br />
outstanding processing of revenue foregone expenditure due to indigent beneficiaries;<br />
Services charges – Sanitation revenue - Favorable variance of R5.446 million mainly as a<br />
result of outstanding processing of revenue foregone expenditure due to indigent<br />
beneficiaries and the implementation of the new valuation roll – objections not finalised;<br />
Services charges – Refuse revenue - Favorable variance of R1.557 million due to increased<br />
<strong>co</strong>llection of trade waste removal and outstanding processing of revenue foregone<br />
expenditure due to indigent beneficiaries;<br />
Interest earned – Outstanding debtors – Unfavourable variance of R1.022 million due to the<br />
over-estimation on the interest revenue;<br />
Government Grants and subsidies – Operating (R199.084 million) favourable due to the<br />
equitable share received in advance for five months;<br />
2


